BTC downfall is getting worse with each passing days and it continues to resonate with the stock market fall. The worst thing to digest today was BTC plunged below the 20k mark and for the first time ever in history of 12 years, BTC could not able to preserve the previous all-time-high.
The chart structure does not give any hint either for a relief rally or correction at the moment. The follow through bearish candle on daily chart making it worrisome for the TA traders. So at the moment we can only become a spectator. The headline on the broader market is also creating FUD of recession. The geopolitical tension is another thing to make it worse when it comes to overall sentiment.
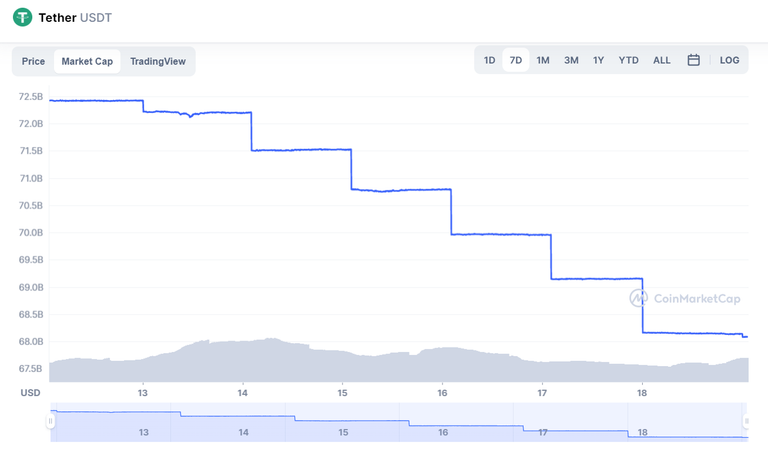
On the other side of the market. USDT marketcap further dips which again not a good sign. As such USDT has been under the radar and many whales are cautious with USDT as of now since the collapse of stablecoin UST.
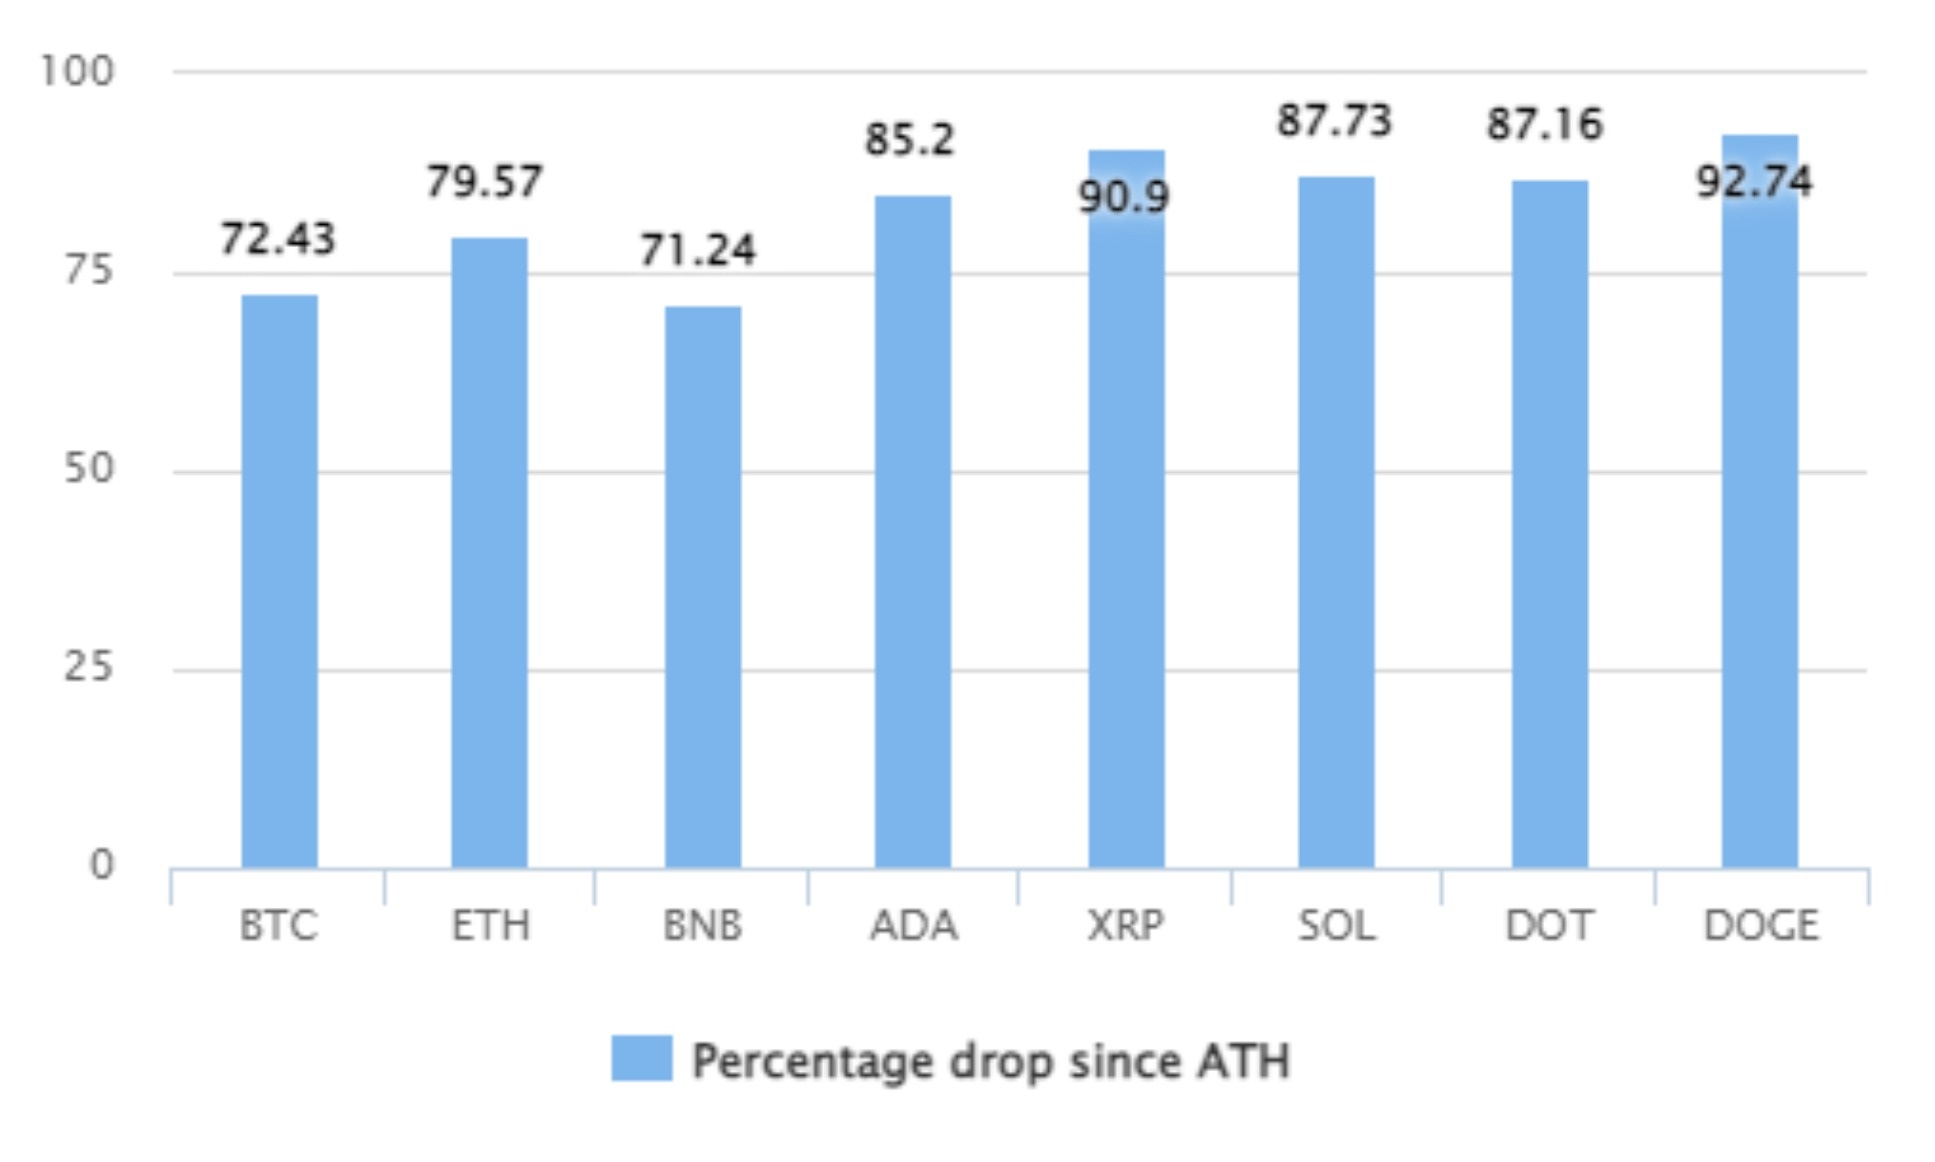
The top coins like BTC, ETH, BNB and others have lost more than 70% since their ATH. Dropping more than 80% of the ATH has always been a story of crypto, that does not bode when we talk about widespread adoption, sustaining it. The trader/investors/crypto enthusiasts also need to distinguish between price and value.
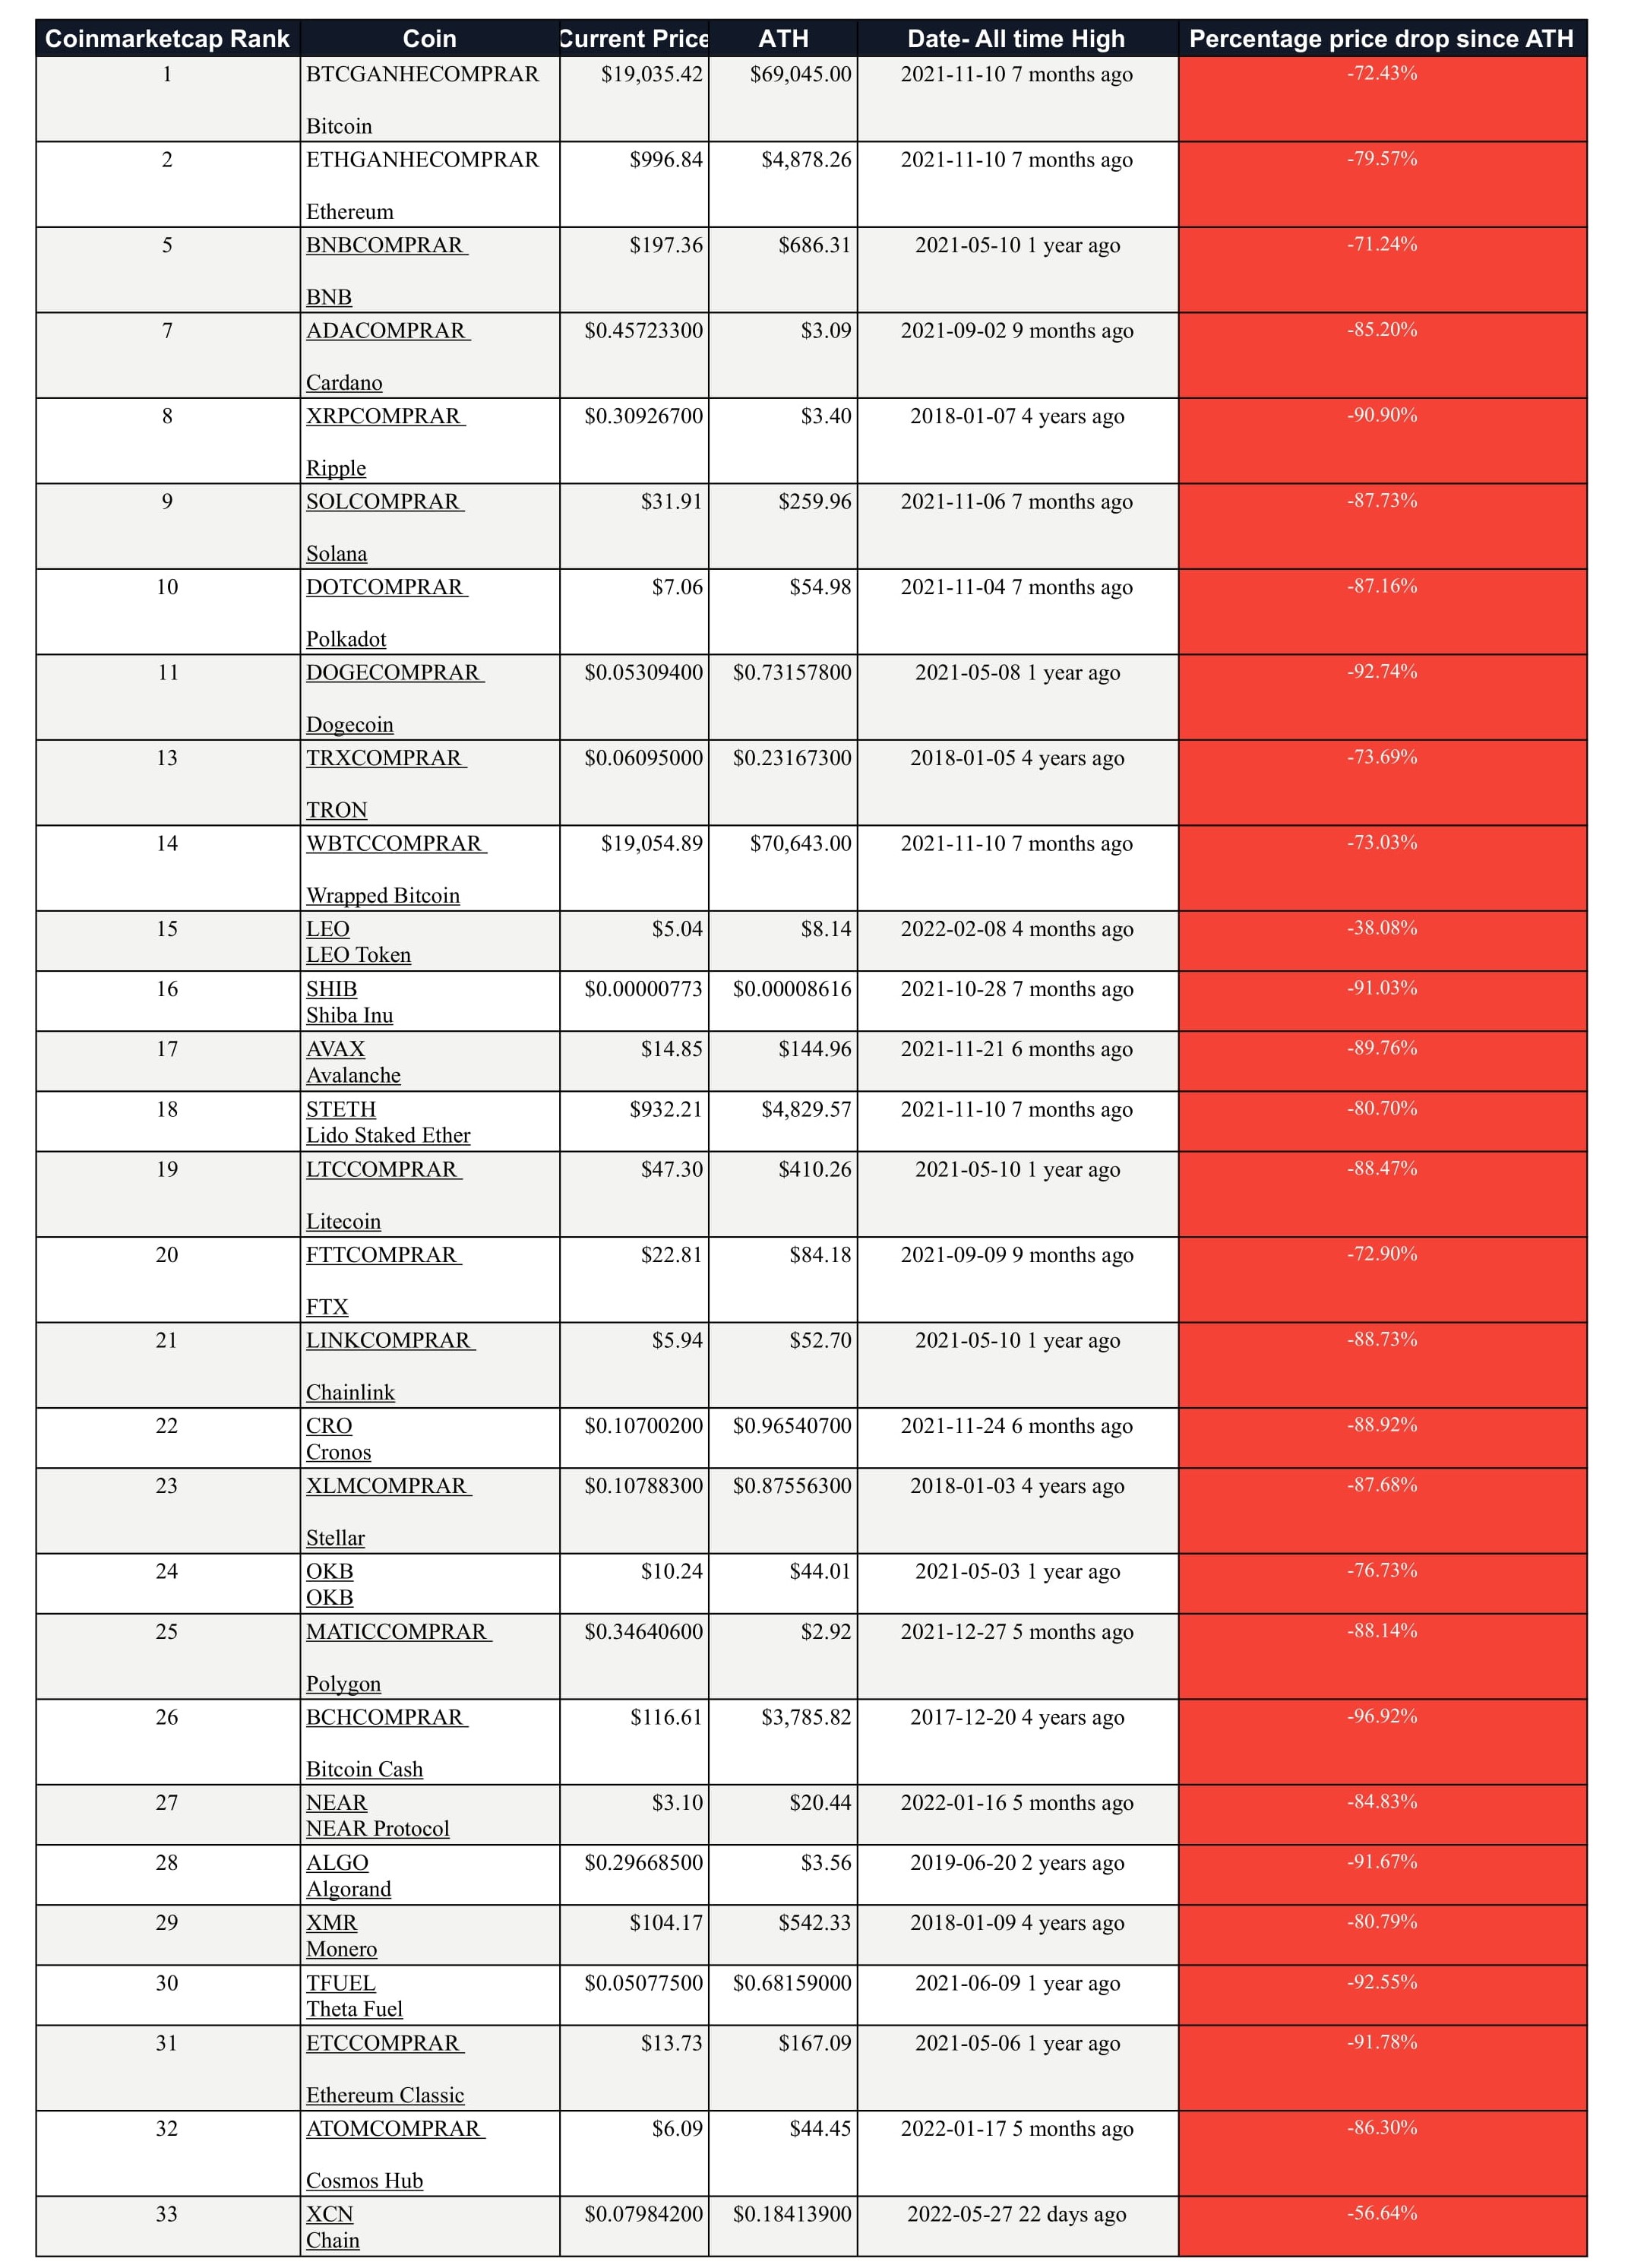
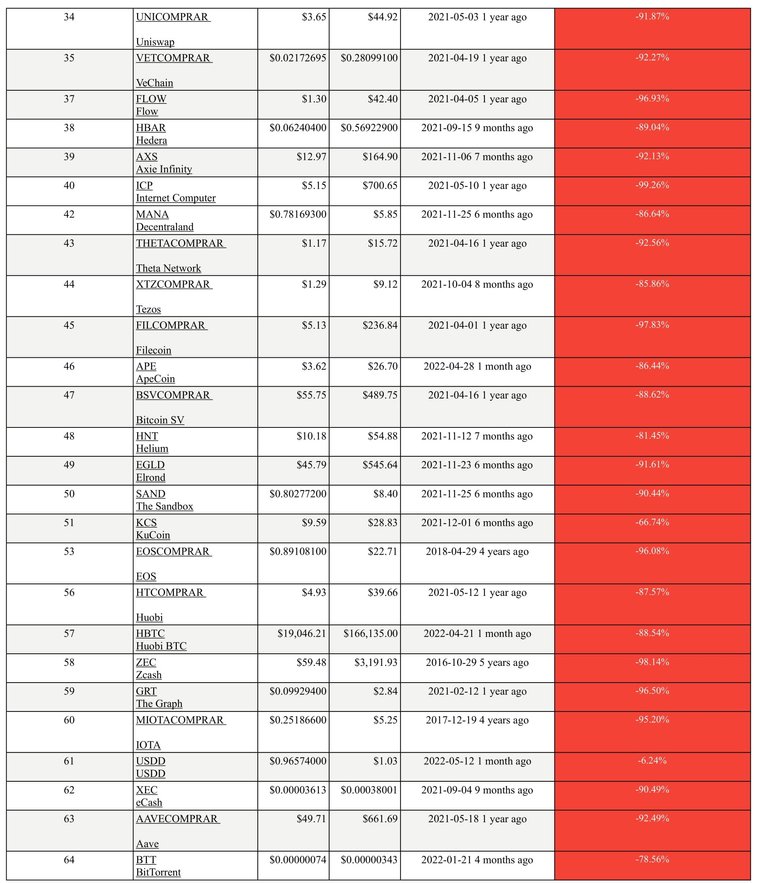
Source: Coingolive
Price is driven by supply/demand it is bound to suffer fluctuations and volatility. The problem for a few traders who suffer loss from such an unstable environment is that for the price is always a mistaken identity. You can not equate price as value. They both are different. Value is that which is predictably useful and that which retains the purchasing power. Think about Gold, why it is still the top asset in terms marketcap. Bitcoin is the digital gold, no problem with such an assertion. But when you talk about the value of a crypto you must predominantly talk about its utility. So the usefulness of a coin should not begin from its coinmarketcap rank or price, rather the deliberations should be on its utility.
That said, let's have look at the chart and the Global positioning of IN/OUT of the Money in Bitcoin to ascertain the next level of support and resistance.
Global In/Out of the Money- Bitcoin
It tells about how many addresses and at what price range the the addresses are holding Bitcoin, whether the price range of the cluster is above the current price or below the current price. If a articular cluster is above the current price then it is Out of the money, if a particular cluster is below it, it is said to be Into the money.
GIOM in terms of addresses

Source: Intotheblock
At the time of writing this article, only 46.72% of the addresses are into the money whereas 50.48% are out of the money and 2.8% of the addresses are at the breakeven.
During the bull run, the Global into the money addresses were steady above 70 to 80% most of the time, in fact, when BTC was trading above 60k, this figure was more than 90%.
So this is a sign of the bear cycle as majority of the addresses are out of the money. If the fresh batch of investors or hodlers, join and accumulate at the lower levels, then this figure would adjust itself and favor into the money percentage.
GIOM in terms of price

Source: Intotheblock
Each cluster is defined by a price range, average price, volume and total nos of addresses. These clusters are significant to determine the potential support and resistance.
All such values have been tablusted:-
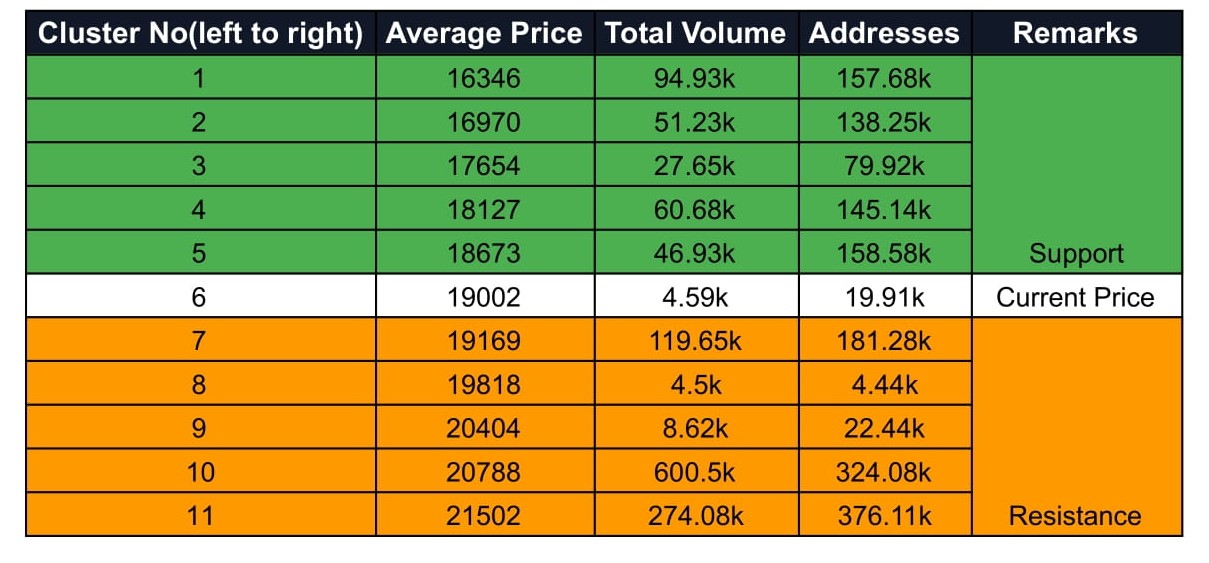
Each cluster weighted with volume and addresses could either act as a support or resistance. Generally what happens, most of the hodlers based on their perceived level and strategy continue to accumulate and strengthen the clusters, similarly those who want to exit, wait for the exist liquidity and that also coincides with the major clusters.
Together with these GIOM clusters and TA of the chart one can conveniently time the market both in terms of entry and exit.
TA of BTC
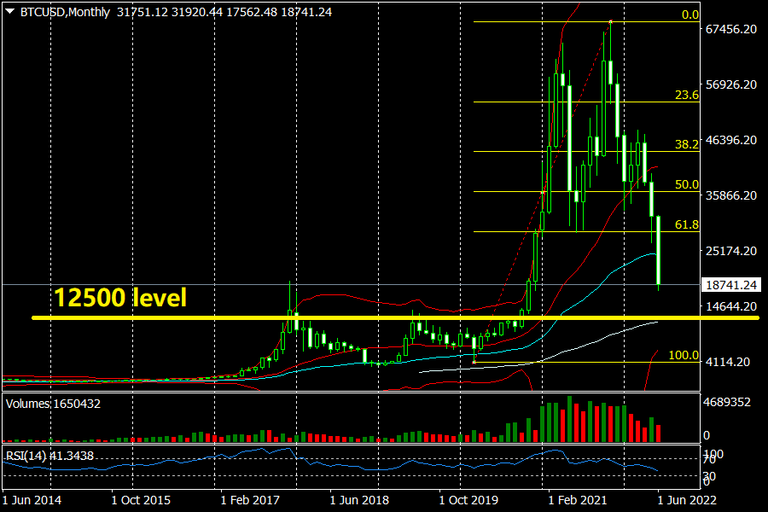
This is the monthly chart of BTC. It started rallying from 3700 level back in 2020 and reached an all time high of 69k in 2021. Since then it has been a story of altitude sickness for BTC. But we only got the confirmation when it broke down below 29k zone.
In the monthly chart, the next significant support is the 12500 level as that is the 200 SMA zone. However, considering the extreme readings of RSI together with other TA indicators, a relief rally could be expected before that, may be around 16k zone. Another support is at 14000 level.
Conclusion:-
It won't be wise to get tempted and speculate the bottom at the moment. It's better to become a spectator. We have not yet seen a bullish candle and follow through candles in the daily chart of BTC. And perhaps we can not expect a v-shape recovery soon, because the global financial template does not favor such a scenario at least for the time being.
Disclaimer:- This article is intended for educational and analytical purposes only. It should not be construed as financial advice. Thank you.
Posted Using LeoFinance Beta
