The green color is dominating the crypto market. The bears have nothing to hold on to. Bitcoin, in particular, is performing strongly. Technical indicators point to a clear bull run in Bitcoin.
Bitcoin Technical Analysis
The weekly RSI has been above the 50 level for two weeks. With the last increase, it reached 70. All major moving averages on daily and weekly charts have been crossed. Thus, the medium-term upward trend became apparent.
The 30-31k band is a critical support/resistance zone. When this level was broken downwards, the bear market was confirmed. Now that this region has passed, Bitcoin's bull market has begun. Price corrections are likely to occur in the coming days. However, our first target is 40k, another critical support/resistance zone.
Bitcoin's outlook is strong, and its medium-term trend is up. What about altcoins? First, let's look at the situation of Ethereum because Ethereum differentiated itself positively from other sub-coins this year.
Ethereum Technical Analysis
The increases in the last three days enabled the weekly RSI in Ethereum to rise above 50. The weekly RSI measures the direction of price movements in the previous 14 weeks. RSI being above 50 indicates that upward momentum is building in Ethereum. The RSI needs to stay above 50 for another 1-2 weeks to confirm the upward trend.
On the daily chart, Ethereum's price crossed its 200-day simple average. That indicates a medium-term upward trend. However, Ethereum could not overcome its previous peak in the bear market, unlike Bitcoin. The price must exceed $2000, which has been tried twice so that we can claim that the bull market has begun for Ethereum.
For Ethereum, technical indicators do not provide a clear picture. Will Ethereum follow Bitcoin or stocks that have been declining in recent months? For Ethereum, cautious optimism would be the most rational attitude.
Hive Technical Analysis
Hive behaved like a typical altcoin throughout the bear market. Hive's market cap ranking on Coingecko ranged from 200 to 230. Therefore, we can assume that Hive will move in parallel with the altcoin market in the coming period.
With the recent price increases, Hive's weekly RSI value reached 50. Hive price is also at its 200-day simple average. If market pricing remains strong in the next few weeks, we can discuss an upward trend for Hive. For now, we are only talking about one possibility.
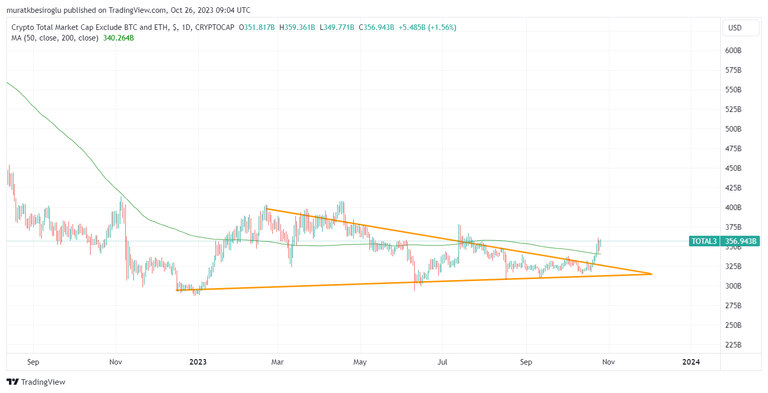
The performance of Total 3, which shows the total crypto market value excluding Bitcoin and Ethereum, will guide us on the future of Hive.
The weekly RSI value of Total 3, which represents altcoins, reached 55. This number indicates an apparent increase in momentum.
The chart below shows that the altcoin market value broke the downward trend it has been in since March 2023.

We also see on the chart that the 200-day average has been exceeded. If the value of altcoins exceeds the $377 billion level reached in mid-July, we can be more comfortable about the rise.
TL;DR
This year's price movements showed us that Bitcoin first increased, followed by Ethereum. Other altcoins are following Bitcoin and Ethereum.
First of all, Bitcoin has risen and continues to increase. We have to admit that Bitcoin has entered a bull market. Even my college student son bought Bitcoin with the $50 he saved from his pocket money. So he's feeling the FOMO. We may see correction movements in Bitcoin in the coming days. However, the increase will likely continue.
Ethereum, the second safest haven, has also performed well recently. The weekly RSI is above 50, and the 200-day simple average has been crossed. $2000 must be crossed permanently to confirm that the medium-term trend is upward in Ethereum.
When prices in Bitcoin and Ethereum reach saturation point, investors will turn to other altcoins. Of course, there may be altcoins performing well in the meantime because market makers will cherry-pick before the uptrend starts. I hope Hive will be one of the altcoins bought before the general rise.
Thank you for reading.
