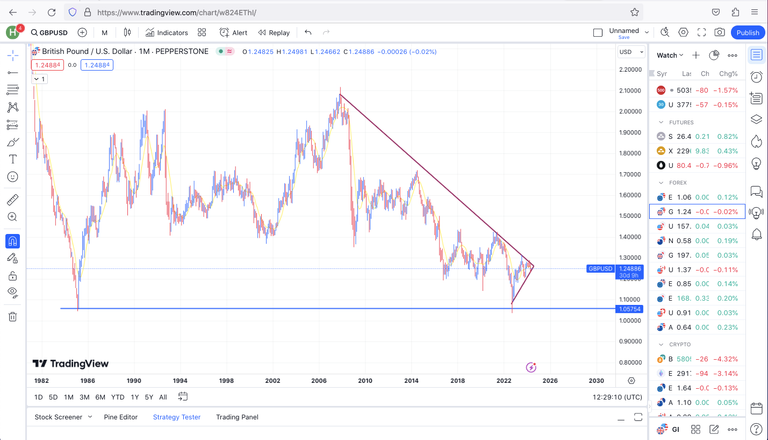
Since the GBP/USD currency pair has been in a downtrend since December, 3rd 2007. From the monthly timeframe, (when it got to 1.05754 support level that happened in 1985), there was a re-bounce of the currency pair they started a reversal/retracement up to 1.28220 region. If u pay close attention you'll notice it is now forming a symmetrical triangle on a monthly time frame.
From the monthly time frame, we have to wait for a breakout from the symmetrical triangle to either the upside(to buy) which means it has completely resumed a bullish trend or the downside (to sell) which means it's expected to test the former support level.

It's best to wait for the breakout before taking any action. However, take a deeper look at the smaller time frame both weekly and daily to see if there's an opportunity to trade this currency pair.
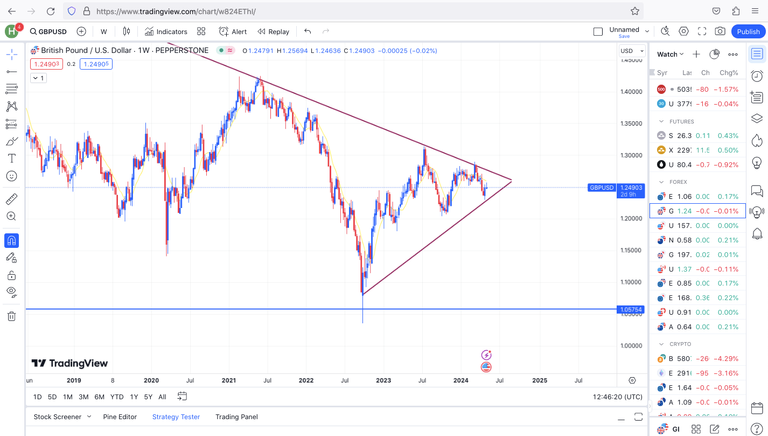
The weekly time frame has been positive in relation with the monthly time frame.
The downtrend is in line with part of the monthly time frame, there isn't much difference between the monthly and the weekly time frame. There can be a breakout anytime soon, we just have to wait it out.
We are expecting the market to test the resistance which is supposed to happen around 1.26820.

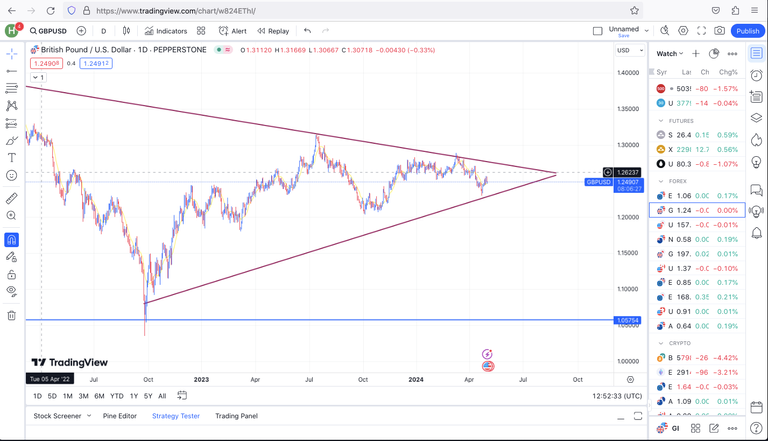
On the daily time frame the slight uptrend still continues, it's tested to the support level at 1.22918 the current position is 1.24892. An expectation is for it to fill up the gap to 1.27012 region. Its expected for the currency to buy more however, there's been some support level at 1.24894 region. The market should resume back to test the support at 1.22938.
On the daily time frame, it's either to test the resistance at 1.26581 or test the support at 1.23721. The best move is to stay out of the market because there's no valid entry point.
We await CPI today for a crucial decision making.
Posted Using InLeo Alpha