We went through a period where there were accelerated prices. At this moment, we are still not back at the previous levels in many things. However, it is good to take a look at where things stand, especially with commodities. These are often powerful drivers in the pricing of other products. At the top of the list is energy and for obvious reasons.
Remember when the Fed said this was transitory? All the inflationists went beserk eventually forcing Powell to retrace his steps. The reality that this high CPI was always transitory. This was not caused by a massive run up in the money supply. Instead, we had supply chain disruptions caused by the shut down of the global economy.
In response, the Fed increased the Fed Funds Rate, knowing it would not help the supply chain. Nevertheless, it could affect demand which we are seeing.
As for the commodities, it is a good time to look at the path these took.
We will start with something most in the developed world need.
Gasoline
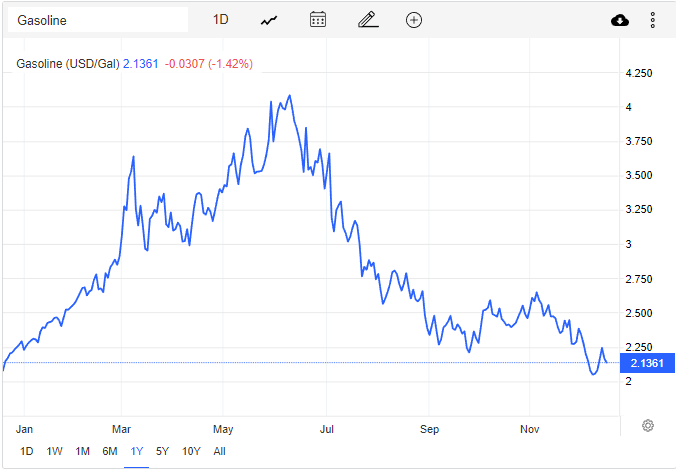
It went up and now is it coming down. Let us scale out to see where things are.

Wow look at that. The price is now at the top of the range it was at from 2014-2018, a level far below where it was 2010-2014. Yet we hear how the price of stuff keeps going up.
Lumber
I chose this one because this was all over Twitter after it ran up to $1700. Of course, it was due to the Fed "Printer goes Brr".
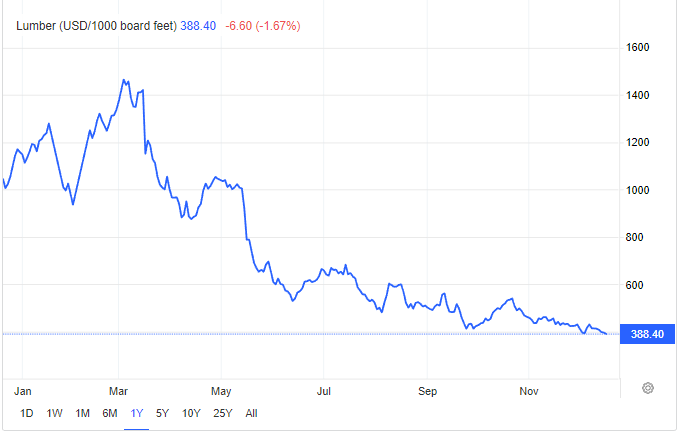
How will this look in context?

This is what is called transitory on a macro scale. It was a rought two years but look at lumber, back in the same range where it lived for the past two decades.
Wheat
Wheat is another fun one since it was a favorite of the doom and gloom people after the Russian invasion of Ukraine. Obviously, this dealt a blow to the supply on the open market since those two countries are major producers.
It is easy to see on the chart where the invasion occurred.
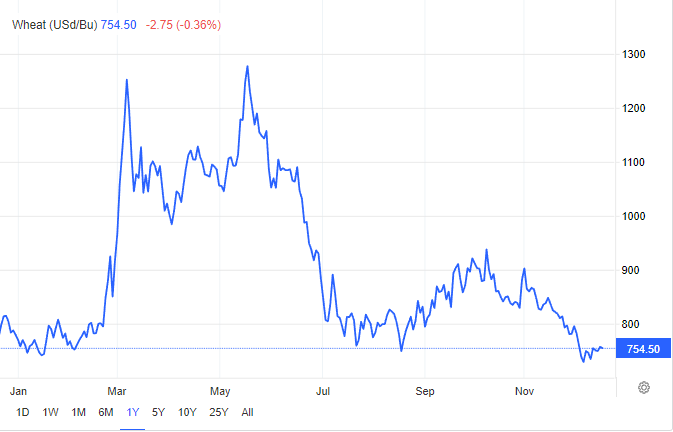
Let us step back.

We are still elevated which isn't a surprise since tensions are still ongoing. However, there is something interesting on this chart: the bull market started in 2016. Wheat was running long before the Russian invasion and the Fed's printing press.
This is how commodities work.
Steel
Industrial metals are really a barometer on the economy. So the move in steel isn't too surprising.
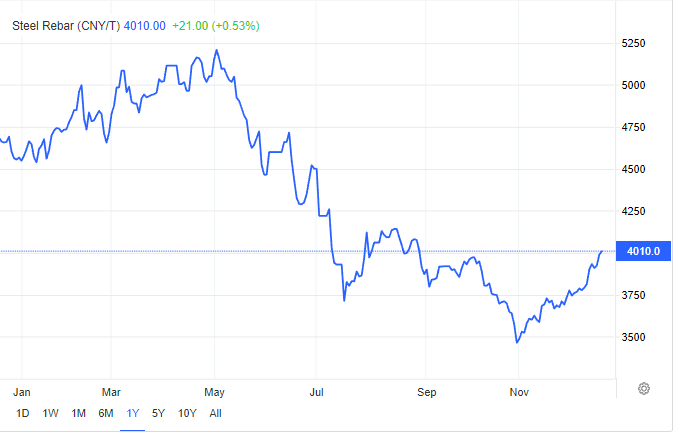
Stepping back, we see where things stand.

Back in the range of 2016-2018. Transitory.
Natural Gas
Certainly this is one that is ugly. After all, they (most likely the USG) blew up the pipeline.
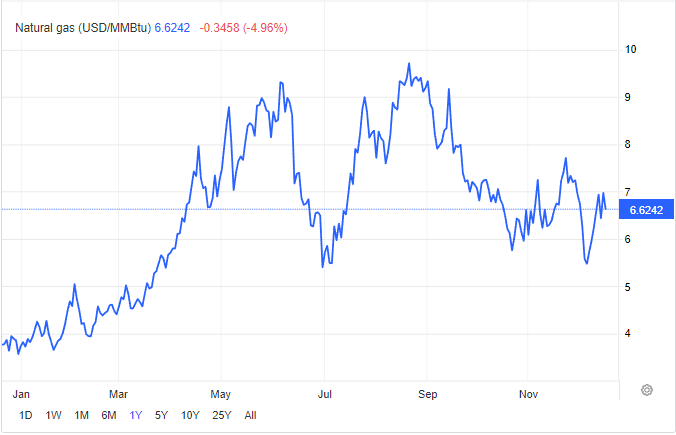
Stepping further out, we see even the high wasn't record setting.

Goldman Sachs Commodity Index (GSCI)
This is the index that tracks the prices of all commodities. This uses market pricing to determine the input.
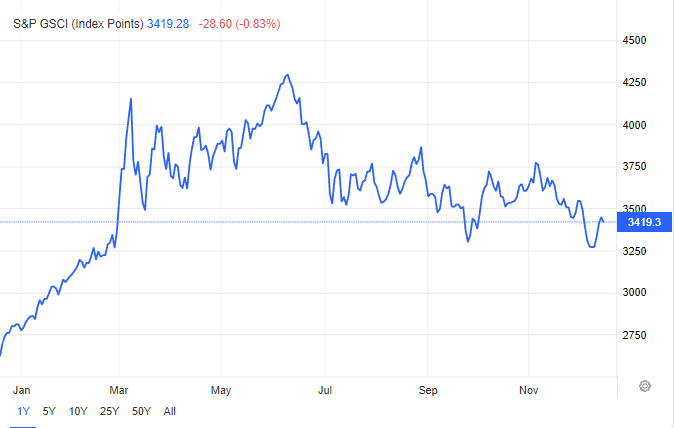
Seems a bit range bound. How does this compare to the historical chart?

We are at the lower end of the 25 year average. It is true we still are higher than 2015-2019 but we didn't even make it to the range of the the 2010-2014 commodity bull run.
Anyone remember $140 barrel oil back then.
Always Ignore The Inflationists
Are there some commodities that are stuff elevated? Sure.
Look at orange juice.
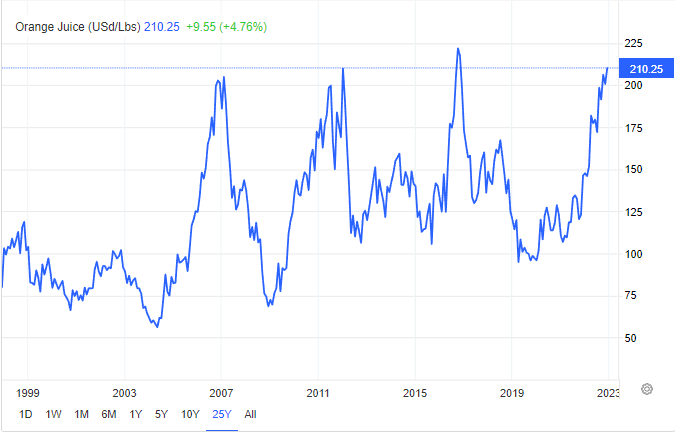
We won't even talk about Lithium which is in the stratosphere.
However, the inflationists tell us how hyperinflation is always around the corner and the end is near. For those who are not aware, hyperinflation is a run in prices at the rate of 50% per month. Outside some countries that nuked their currency, this is not even conceivable. The CPI registered bit over 9%, year over year (not monthly).
Of course, now that the CPI is declining, we will hear how it is manipulated and doesn't truly reflect what is taking place.
The reality is the inflationist were wrong once again. I can say in my 30 years watching markets, their track record is perfect. They are always talking about the end and yet, over time, we see the charts telling a different story.
Unfortunately, cryptocurrency is filled with this sort of stuff. Bitcoin was sold based upon a lie. We were told that Bitcoin was a hedge against massive inflation and the collapse of the USD. What happened?
As the CPI exploded, Bitcoin's price imploded. Anyone who was looking for BTC to protect against a massive run up in the CPI was wrong. Of course, the USD only took off at the same time showing everyone where the true safety net resided.
The reality is most people's economic, monetary, and financial framework is built on fallacies. They fail to understand how money is truly created, what it is, how the monetary system works, and the global nature of cash flow.
Commodities are a major piece of the pricing puzzle, albeit not all. Tied to this is technology which affects commodities in a major way along with other pricing components.
The long-term GSCI chart tells the entire story. Our entire global commodity markets are essentially in the same range as 20 years ago. They moved a great deal but the return was basically flat.
By the way, all of this is happening against a backdrop of a 30+% increase in population since 2000.

Yet somehow commodities are flat overall.
What does this tell you?
If you found this article informative, please give an upvote and rehive.

gif by @doze

logo by @st8z
Posted Using LeoFinance Beta
