All the discussion is on inflation.
The Fed keeps talking about it at their FOMC meetings. Powell is out in the public mentioning how it is a battle. The mainstream media is constantly hammering on it. And, of course, the Twitter "economists" are all screaming about money printing and hyperinflation.
In this article we will go through some of the turning points. Keep in mind, we still have the ongoing situation in the Ukraine, Russia under extreme sanctions, and OPEC refusing to increase supply.
Yet, in spite of all that, we are seeing things starting to move in different directions.
Many want to tell the story of oil on the way up. If that is the case, certainly it applies on the way down.

Oil Telling The Story
Look at the 25 year chart for oil. This is a hot topic these days.
After peaking at $120, we now see oil is under $75. From a historical perspective, this is still a bit elevated but not out the the realm of where we were before.
You will notice we touched the highs in 2018. Hence, we were at this point 4.5 years ago.
Also, it is worthy to look that from the beginning of 2010 until June of 2014, we were higher than we are now. That means we had higher oil prices for more than 4 years.
Oil is a commodity that relies heavily on the supply and demand equation. While emotions can enter, the underlying fundamentals will surface. Right now, we are seeing the destruction of demand for oil. Will this continue? Time will tell. However, the recession many are forecasting is not here yet, at least for the world's largest economy.
What does oil look like if the US tanks completely?
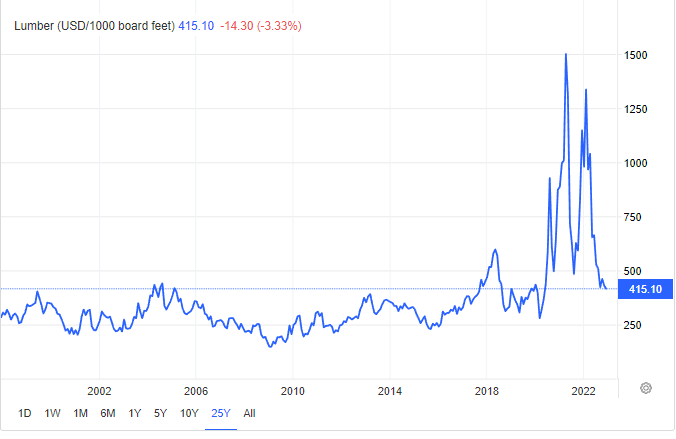
Lumber Telling The Same Story
Remember when lumber was the poster child for the "money printer go brr" memes on Twitter? Many were asserting that the Fed's actions of printing near unlimited money (even though the Fed doesn't create USD outside of banknotes) was showing up in the price of lumber.
Here is also a glimpse at the 25 year chart.

Like oil is a bit elevated compared to historical norms but stil in range. We are lower than 2018 and equal to 2006. If you remember, that was right about the time the US housing bubble was bursting.
Once again, if it is good to use as an example on the way up, it should equally apply on the way down.
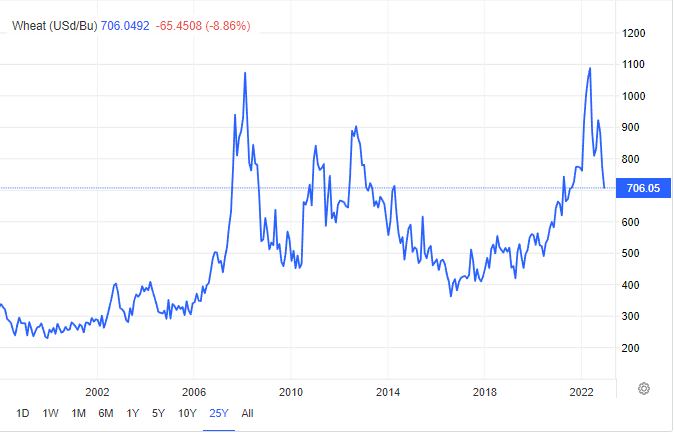
Wheat Warning Of Famine?
The Russian invasion of Ukraine sent the wheat market spinning.
To start, Ukraine is a major exporter of wheat and their supply is basically offline. At the same time, Russia is the same and, due to the aforementioned sanctions, their crops are not going to be flowing around the world.
Many are forecasting famine with the potenital for a billion people to starve. This could be the case. However, for now, the wheat market is telling a different story.

After spiking up in February and March of this year, we see how things have pulled back. Once again, we are not operating in uncharted waters here. With wheat, it has been a while since we were at these level. However, it is vital that we understand commodities are cyclical. We previously were at these levels during the last bull run.
Of course, what happened in 2014? Like most commodities, we saw a hard drop down.
By the way, also notice how the price of wheat bottomed out in 2016. The bull run is more than 6 years old in this commodity.
But The Fed
There is one final point that we need to mention regarding this discussion.
We see 2018 come up regularly as a point last hit with many commodities. There is a parallel between now and then.
At that time, the Fed was tightening. It thought we were facing inflationary pressures and that interest rates were too low. This is something that they are beating the drum about now.
What happened?
Chairman Jerome Powell was caught with his pants down. He was raising when he should have been lowering. Of course, eventually they got what the market was telling then and abruptly reversed course.
Anyone want to guess what will happen this time?
We are heading towards trouble economic times. That much is for certain. The Fed raising entering a recession is certainly something new. But then again, they want to maintain some relevancy in the discussion.
It is always hard to predict when bull markets end. Commodities could keep running. However, thus far, they are backing off.
In the end, it is hard to maintain the bullish sentiment when the economy is in recession. We tend to see it first in industrial metals then spreading to other areas.
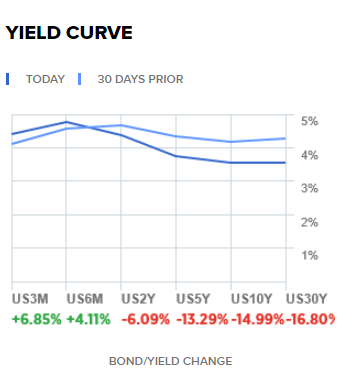
Like most things with the economy, nothing operates in a vacuum. However, when we step back and see what is going on, we are reminded of the yield curve.

Source
This is telling us the same story. Economic growth and inflation expectations are simply not there. The long end of the curve is moving down at an accelerating pace compared to the shorter end.
It is not a good sign economically.
If you found this article informative, please give an upvote and rehive.

gif by @doze

logo by @st8z
Posted Using LeoFinance Beta
