Good day Hiveians!
Join me in analyzing the crypto markets!
Here is a cool little trick for TradingView
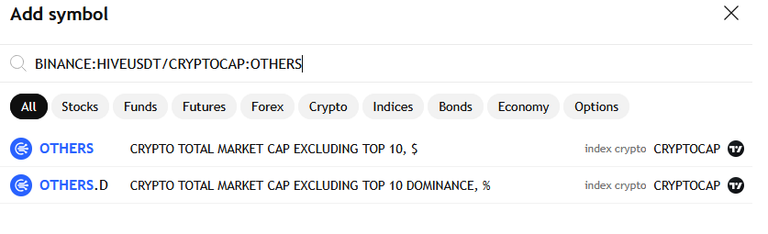
I stumbled upon this feature on X by a post from @mahdiyari where he explains that one can do all sorts of things with charts in the search bar. For me personally, it doesn't quite show in the interface (maybe a subscription is necessary), but I found that it also works by simply writing it in the search bar. I am talking about basic mathematical operators like addition or multiplication. Comparing a coin with another or an entire market (like the ALT market) one can simply divide a coin by it with "/". So for HIVE we can e.g., compare it with other Alts (excluding the top 10) by writing this in the search bar:
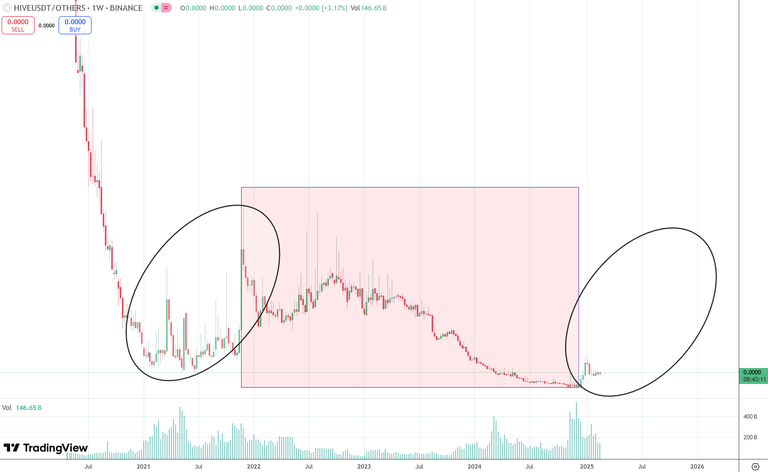
What we get is this chart:
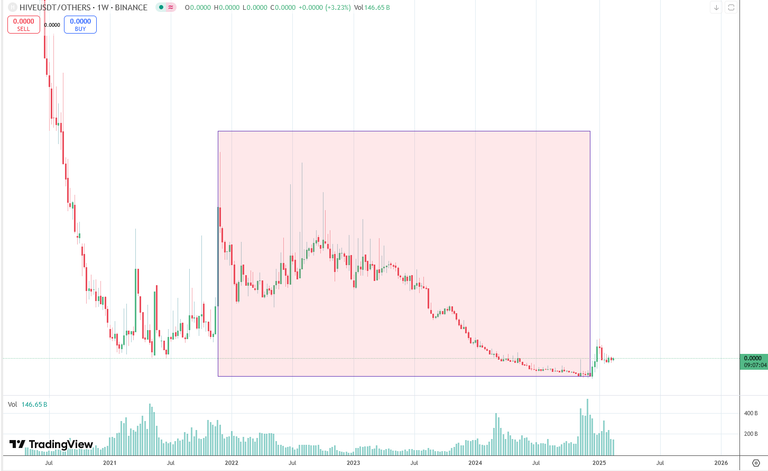
It's nothing too revealing, but it does highlight the 3 years of pain we have seen for Hive. Compared to other Alts, it's clear that Hive was indeed lagging behind. Since November 2024, Hive has been on the rise and also outperformed the Alt market. It's nothing dramatic, but still... The downward spell has been broken for now. If 2025 is indeed Hive's year, then the next months could look perhaps something like what we saw in 2021 - extreme volatility, with a general uptrend.
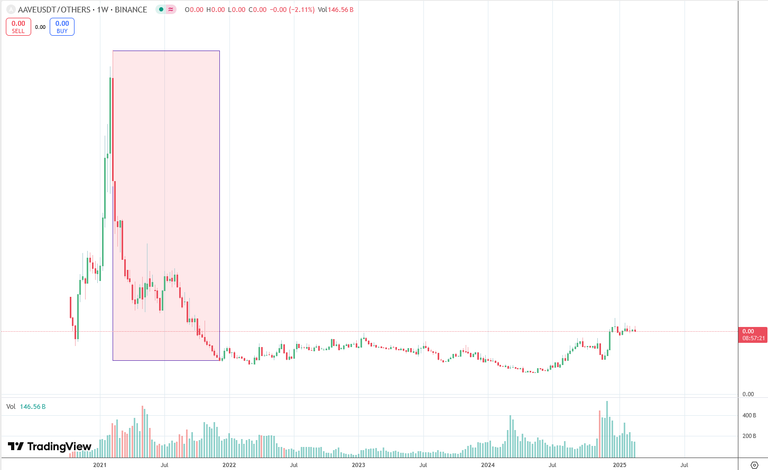
We can do this for other coins as well, of course. Here are some charts for RUNE and AAVE:
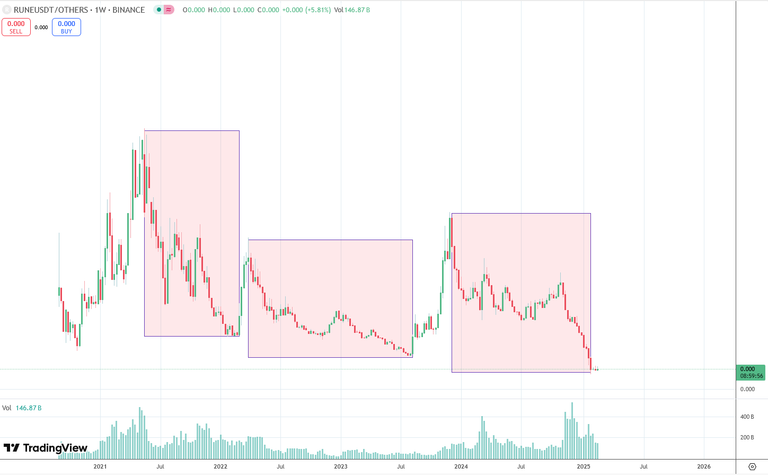
Their charts look quite different than Hive. For RUNE we have seen 3 dramatic uptrends with corrections making lower lows. The recent drama has brought it a new ATL. Perhaps this could be the start of an epic reversal?
For AAVE the chart looks very different yet again. A massive spike and a wopping 90%+ drop in just a year. Not even Hive has seen something similar. Since then price has been relatively constant compared to other Alts. For almost 3 years it has flatlined. Starting in summer of 2024 it has started to outperform the ALT market. This could also be interpreted as a reversal.
Conclusion
Considering that I have used TradingView for many years, it's cool to learn about this "new" feature. I want to experiment a bit more with it and feel free to share what you know as well! While the "bull market" of 2025 doesn't "feel" like it is here yet, many Alts seem to have bottomed out and it remains to be seen how much they can outperform the others.
As a general reminder: Please keep in mind that none of this is official investment advice! Crypto trading entails a great deal of risk; never spend money that you can't afford to lose!


Check out the Love The Clouds Community if you share the love for clouds!