Good day Hiveians!
Join me in analyzing the crypto markets!
Once again Hive did its thing
We pumped in a red market (like always) and dumped almost all of the gains. That's always frustrating. But I guess you have also gotten used to it if you have spent any time tracking the price of Hive. There is a silver lining, however: These pumps and dumps generally carry the price higher in the long term. Hence the emphasis on almost.
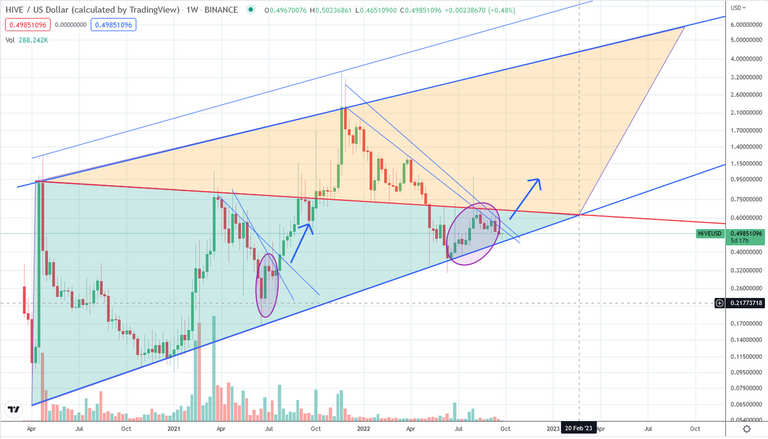
I have been anticipating this pump for quite some time now, but it seems that we first had to test macro support again. When one looks at the chart these pumps become somewhat easy to anticipate although it's always unclear when they will exactly occur. The macro picture is rather clear as mentioned in the last post:

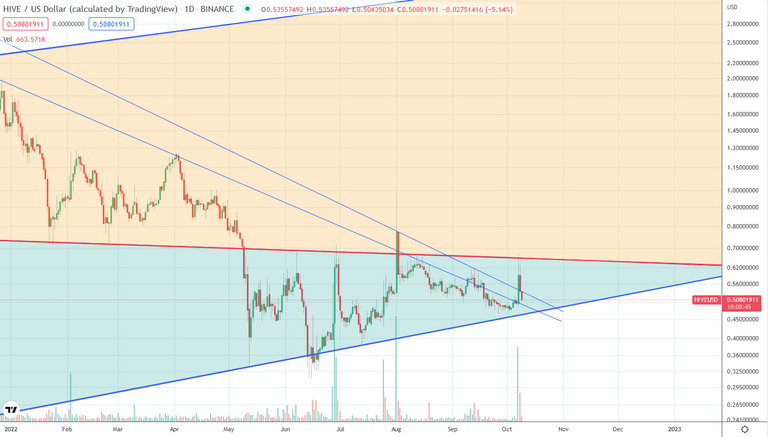
If Hive follows in the footsteps of the 2021 rally, price should move considerably higher over the next year. I have a hunch, however, that the movement will be a bit less steep and more prolonged. With price breaking the weekly and daily resistance trend lines there was only the horizontal line remaining as a major resistance. And this resistance once again stopped price from moving higher (at least for now).

In the midst of the pump I stated:

Well, we didn't hold there for several hours and dumped to 54 cents for the daily close... There was a hope that the pump could continue after retracing there, but nope we went back almost all the way back to 50 cents! In hindsight it would have been of course smart to sell at ~65 cents, but I didn't trade this pump as I am convinced that we'll be at $1 sooner or later again. Notice also that volume was quite high making this one of the bigger pumps. On Upbit it was actually even larger with an incredible 455 million on the daily close. This is as big as the whole supply of Hive! From the price chart perspective, however, it looks more like a middle sized pump&dump.
Spotting the pattern
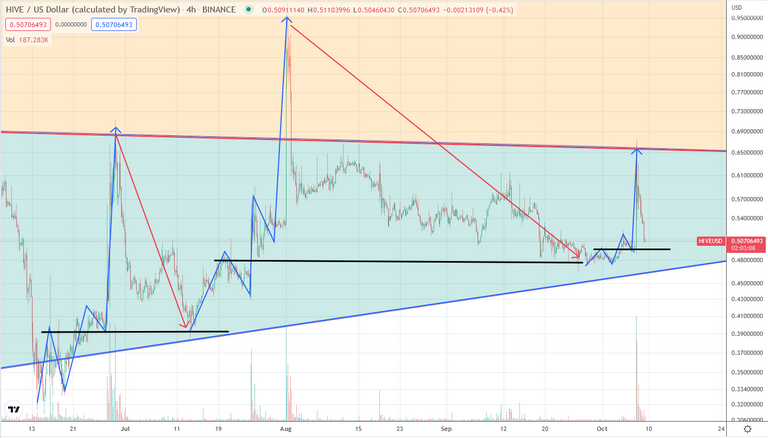
If you look at the chart in detail you can spot an interesting pattern. There are 2 subwaves leading up to the pump and then a decline taking us back to the height of the first subwave.

This has been very consistent and we can assume it to play out again, which would bring price back to around 48-50 cents. The important part, however, is that price during these pumps & dumps has increased (look at the black lines that have a ladder like structure).
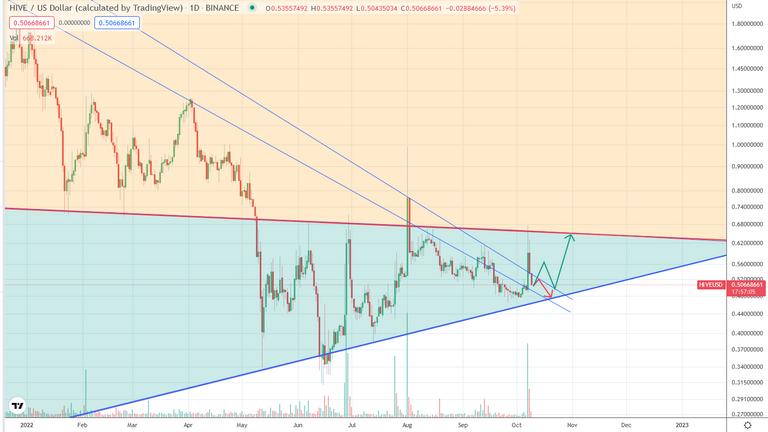
It is clear that price is now stuck in the wedge that is the macro support at the bottom as well as the horizontal resistance at the top.

I see two main scenarios: the red one would see a rejection at the resistance coming from the daily trend line of the former highs; the green one would see a push through this resistance and a retest before breaking out higher to retest the horizontal line.
The first scenario is quite bearish and is problematic because it would invalidate the pattern described above as well as retest the macro support which might not hold. The second scenario seems more probable in my opinion as the volume for the pump was big (often indicating a further price increase), Hive's fractal always has a second peak (lower than the first) and it would also fit the idea of retesting a major trend line it broke out of.
Update: I made this post last night and just saw that price is back to 55+ cents, so the green scenario seems to be on track. I still expect a retest of the daily trend line and then a bounce; a more bullish movement would be what we saw in July: a second peak staying at elevated levels and then another big pump.
As a general reminder: Please keep in mind that none of this is official investment advice! Crypto trading entails a great deal of risk; never spend money that you can't afford to lose!


Check out the Love The Clouds Community if you share the love for clouds!
