Knowing market turning point differentiate you from other traders.
What is market turning point
Market turning point is where DEMAND exceed SUPPLY and vise versa SUPPLY exceed DEMAND. It is where financial institutions and Big Banks stack their financial orders. At this zones you see significant and aggressive movements of candles.
What is order
Order is the instruction of buys and sells of a particular asset or currency pair. Currency pairs involves EURUSD >>>Europe United States Dollar
GBPUSD >>> British Pounds United States Dollar
AUDJPY >>>>Australia Dollar Japanese Yen, and so on
Lets put this into actualization, we have a sell order of $200 and buy order $500 what do you think will happen?
Buyer will definitely dominate the market because of their higher oders so price will definitely rally up in favour of the bulls.
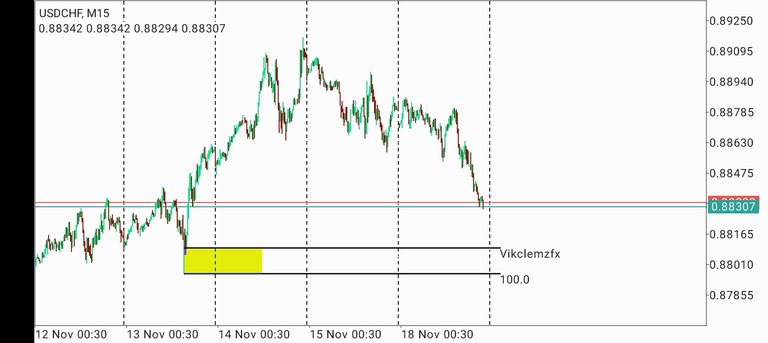
[Image] BEFORE
How the market closes in the weekly time frame is an important data for us trader to locate our zone
Remember the market moves week to week
My weekly Analysis on USDCHF
When USDCHF left an unfill order of DEMAND at level 0.864496, I was able to clearly identify a reversal that banks and other institutions are interested in by marking out a continuous pattern of DEMAND known as a Rally Base Rally (RBR).
I use my Fibonacci retracement tools right away because I can see my entry and stop lost, using the low risk, high reward standard shown in the above image.
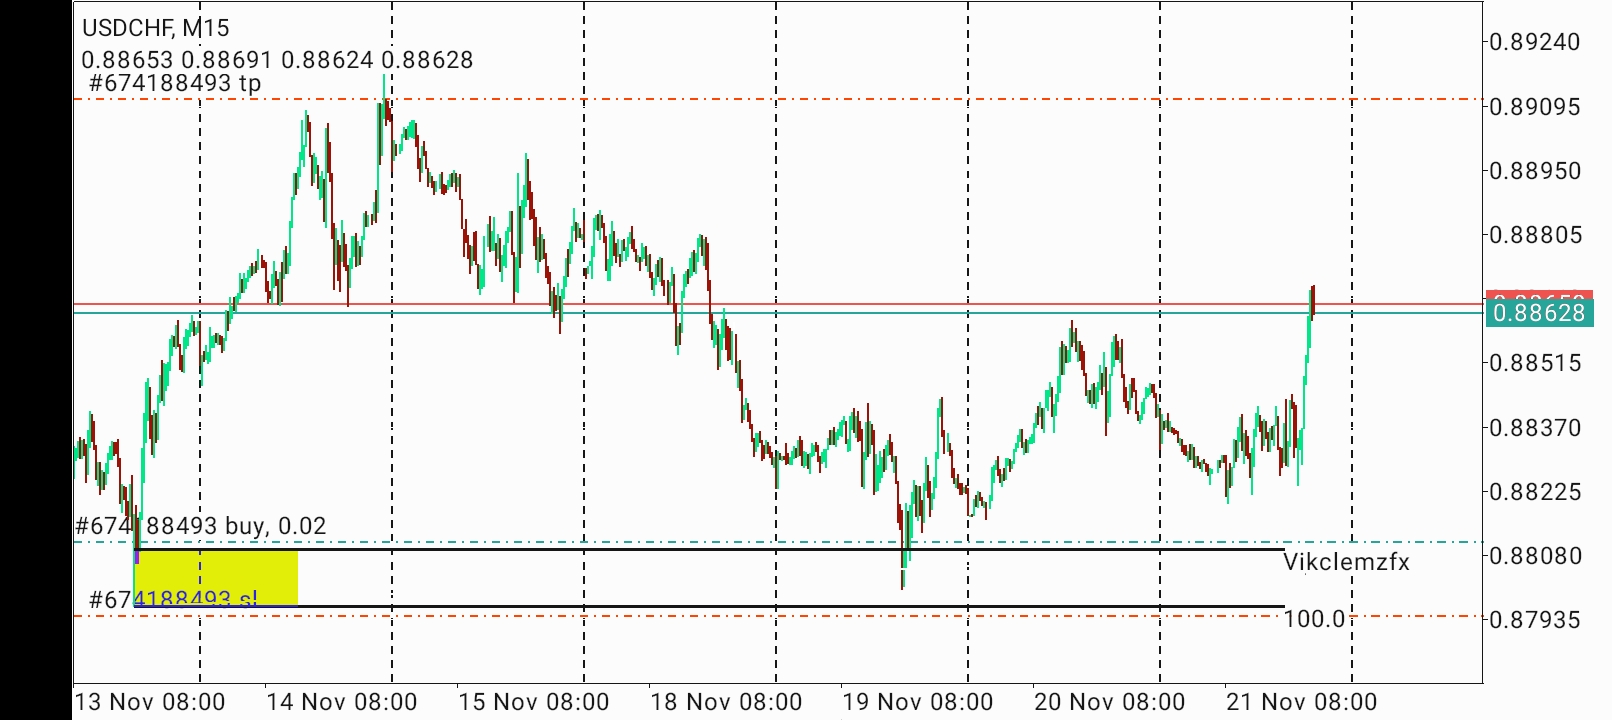
[Image] AFTER

At the price level 0.88268, many retail traders would have close their orders thinking that there will be an opposite movement at the price level 0.88805. why I say so is reason been that at the daily timeframe, a SUPPLY zone was created which was supposed to push price in a downward movement. But that can't be true because if price is coming from a weekly zones daily zones can't opposed it same thing applicable to other timeframe. Higher time frames overwhelms lower time frame please save that in your note. At that level point there was only a consolidation or accumulation which is also known as decision making point,where there was a significant and aggressive rally breaking out the daily SUPPLY zone which left a footprint that weekly time frame can only be negated by weekly and monthly time frames not lower timeframe. I continued wining why?, because I trader a footprints where banks and financial institution are interested.
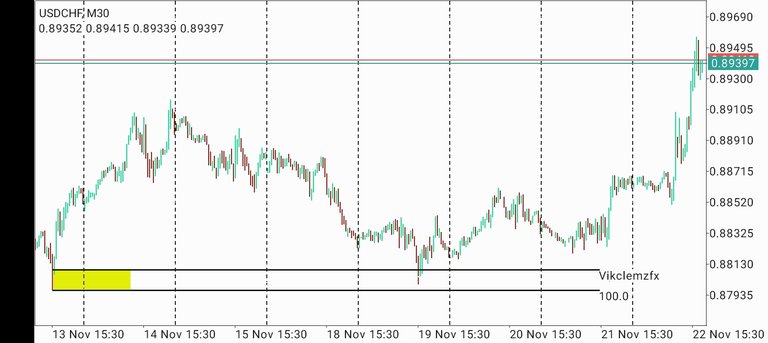
[Image] TAKE PROFIT TESTED"
After which the daily SUPPLY zone was broken, the market created a zone called flip zone . Flip zone is where buyers orders are more than sellers order which will cause price to return back to that zone and a then a reversal. Looking at the second image the was a consolidation created at the flip zone level 0.88805 which was another RBR i.e a DEMAND flip zone. Many traders can enter at that level and still make money reason been that, flip zones are very powerful. From the flip level price was driven to my take profit
FACT TO NOTE
Trading at bank footprints brings great amount of reward ratio, because you are not trading against the bank but just following
Trading at the lows and Highs of a particular candle stick in the daily, weekly, and monthly timeframe is the right location using your odd enhancers
Trade and think like the banks🤔🤔, then you will be 70% wining in your forex trading career. Please reblog and stay tuned as I will be dropping more analysis

