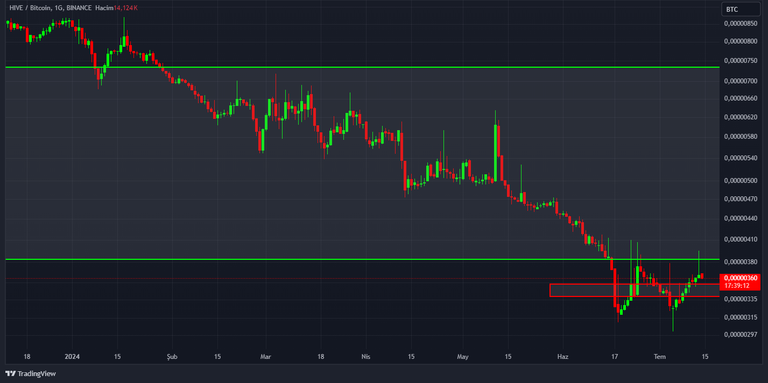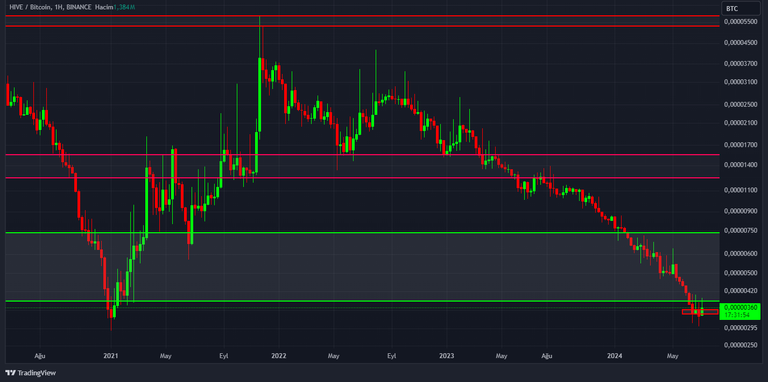
I also made a drawing for users who follow the Hive price on a BTC basis. The screenshot was taken from the daily time period. The supply-demand zone below is passing through the price level 0.0x355-0.x340. The wide supply-demand region above is in the price range of 0.x38-0.x74. The reason why I follow a wide supply-demand region in this way is that Hive experienced an abnormal loss of value against BTC. The chart below is weekly.
