Well it's another day in the life of Hive PIZZA and there is plenty of Holiday cheer to go around.
In the Hive PIZZA discord channel we have a #market-chat which is a great place for us to explore all things market related. Our conversations vary widely and include but are not limited to discussions about crypto market conditions, 2nd layer tokens, traditional finance, etc.
Last night was a good opportunity for me to work on an old hobby of mine which is creating models to value publicly traded companies. This is going to be the 1st blog post in a series and it's important to know the Cost of Equity is a small piece to a much larger puzzle when it comes to valuations.

What is the Cost of Equity?
The Cost of Equity of a firm is the return equity investors require based on a firm's risk. It can also be thought of as the risk equity investors are taking on when investing in a stock. The Cost of Equity is theoretical in nature but can be computed.
It is important to note that a firm also has a Cost of Debt that is separate from it's Cost of Equity. A firm's Cost of Equity can be more or less important depending on a firm's dept position. To try to keep this pizza post digestible, I'll just focus on the Cost of Equity today; we will explore the Cost of Debt and the impact of capital structure in a later blog post.
The Cost of Equity Formula:
Cost of Equity = Risk Free Rate of Return + Beta * (Market Rate of Return - Risk Free Rate of Return)


What is the Risk Free Rate of Return?
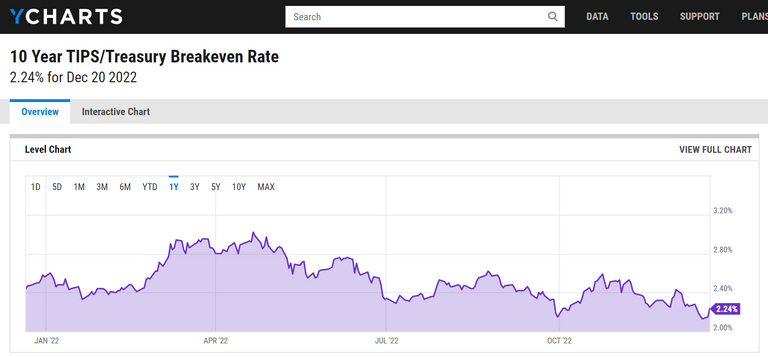
The Risk Free Rate of Return is the return investors expect from a risk free investment. While no investment is technically risk free, this is best represented by 10 year US Treasury Bonds. This is primarily because these are considered one the safest investments and to do our calculation we need a proxy for a risk free investment.
While US Treasuries are a good representation of a risk free investment we still need to adjust for inflation risk. One of the easiest ways to get the inflation adjusted rate is to reference 10 year US Treasury TIPS instead. TIPS stands for Treasury Inflation-Protected Securities. You can pull the TIPS rate from https://ycharts.com/indicators/categories/interest_rates

What is the Beta of a Stock?
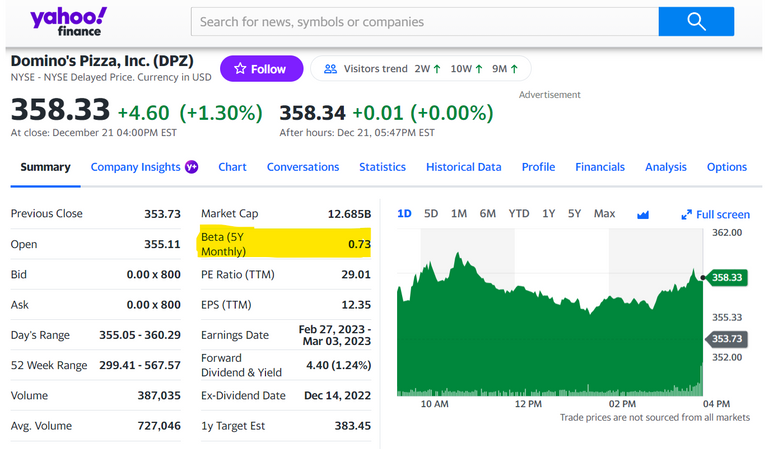
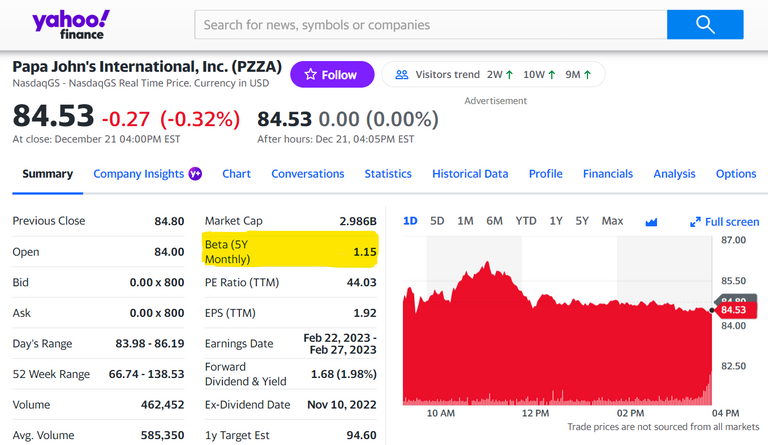
If you have taken a statistics class you have probably heard of Beta before. In traditional finance the Beta of a stock tells us how the stock moves in relation to the market. Many websites that provide stock information will also provide a stock's Beta. The only trick here is sometimes the Beta provided is incorrect or out of date. It's best to calculate your own Beta and then compare with online sources as a check.

How to Calculate a Stock's Beta?
Step 1: Pull historical price data of the stock
Step 2: Pull historical price data of a market index
Step 3: Calculate the return % for both the stock and the market index
Step 4: Calculate the covariance of the stock returns and the market index returns
Step 5: Calculate the variance of the market returns
Step 6: Divide the covariance (Step 4) by the variance (Step 5) to get the stock beta
When I calculate a stock's beta I typically use 3 years of weekly returns and will use the S&P 500 Index as the market proxy. Historical data can be downloaded from finance.yahoo.com Just a warning, if you use the DOW Jones index this will not give you a correct Beta. This is because the DOW Jones is price weighted, I explain Price Weighted versus Market Weighted indexes in more detail in this blog post https://peakd.com/hive-185582/@hurtlocker/the-dow-jones-is-a-stupid-index.
Also, I recommend using excel for the covariance and variance calculations given these are built in excel functions.

Do you need to use weekly returns?
The easy answer is no but I'll still explain the logic in my decision to use weekly returns. I use weekly returns because I prefer to do a 3 year Beta calculation. With a 3 year Beta calculation this is more current than 5 years. If you want to use monthly returns, you will want to use 5 years of returns to ensure you have enough data points. Daily returns should be used in lieu of weekly returns if you don't have at least 3 years of data.

What is the Market Rate of Return?
The Market Rate of Return is somewhat self explanatory, it's the return we would expect if we just invested in the entire stock market versus an individual stock. For this we typically want to just reference history of the S&P 500 Index. We want to use history versus trying to guess what we think the future will be. Simply put, history is supported by data which is better than a guess.
I calculated the Market Rate of Return at 9.51% based on average returns of the S&P 500 over a 10 year period. Generally speaking you want to be somewhere between 7% and 10% for your Market Rate of Return calculation. If you get something significantly different than 7%-10% you should review your calculation and the time period you selected.

Why Subtract the Risk Free Rate of Return from the Market Rate of Return?
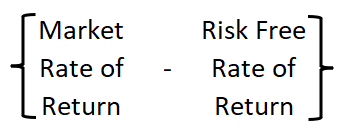
The Marker Rate of Return minus the Risk Free Rate of Return is also referred to as the Market Risk Premium.
The Market Risk Premium is the return investors require above the Risk Free Rate when investing.
If the stock's Beta is greater than 1 this means the stock is more volatile than stock market. If the stock's Beta is less than 1 this means the stock is less volatile than stock market.
By multiplying by the Beta we are taking this increased or decreased risk into account.

Why Add the Risk Free Rate to the Formula?
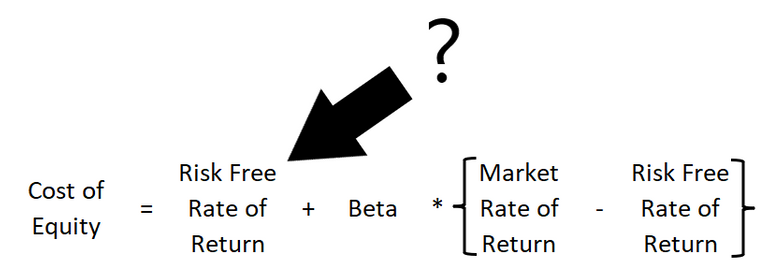
As stated above, the Risk Free Rate represents the minimum return investors require when investing in a risk free asset. If we don't take this into account we are not being fairly compensated. Even if an asset is risk free, as an investor you would need an incentive to invest your money versus leaving it in the bank.

The Results:
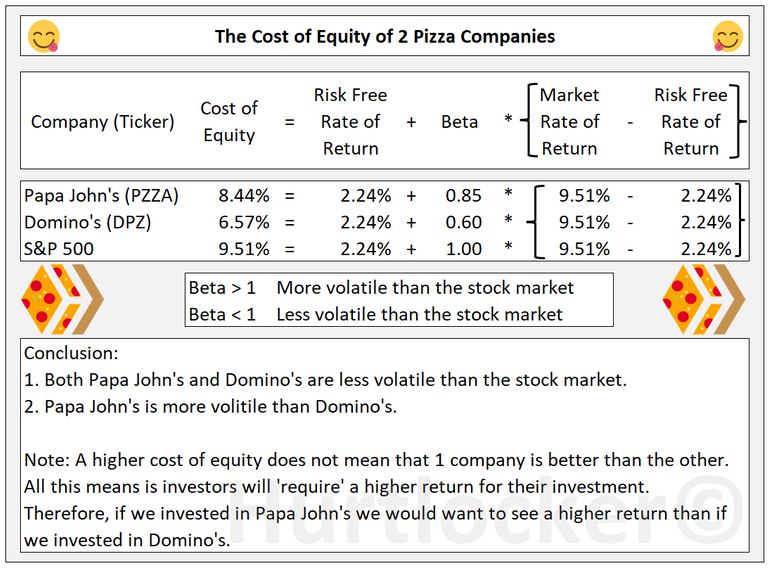

Points About Our Cost of Equity Model:
You may have noticed the Beta provided by Yahoo Finance for Papa John's is 1.15 versus my calculation of 0.85. This is just an example of why it is important to do your own calculations. Yahoo Finance is a great free resource but their calculations are based on monthly returns where as we used weekly returns.
The Cost of Equity is just a small piece of a bigger picture. As investors we also care about how much debt a firm has. This gets factored in when we determine the firm's Cost of Capital which will be covered in the next blog post of this series.
Financial models are not perfect representations of reality. This is an art as well as a science. If you find yourself making decisions solely based on the output of your models you are likely doing something wrong.
Don't fall in love your models! Many investors have learned this the hard way and it's better to learn from the experience of others than make the same mistakes.

For additional information on valuations I recommend the work of Aswath Damodaran. He is professor of both Valuation and Corporate Finance at the NYU Stern School of Business. He provides his data, notes, and lectures for free on his website https://pages.stern.nyu.edu/~adamodar/

If you haven't heard of Hive PIZZA, we are an awesome gaming guild that also loves pizza.
Come stop by the discord channel for weekly events or even share your own pizza pictures in the #pizza-pics channel.
Join the Hive PIZZA Guild Discord - https://discord.com/invite/hivepizza
Visit Hive Pizza Website - https://hive.pizza/
Follow PIZZA on Twitter - https://twitter.com/PizzaOnHive
Follow me (@hurtlocker) on Twitter - https://twitter.com/Hurtlocker360


