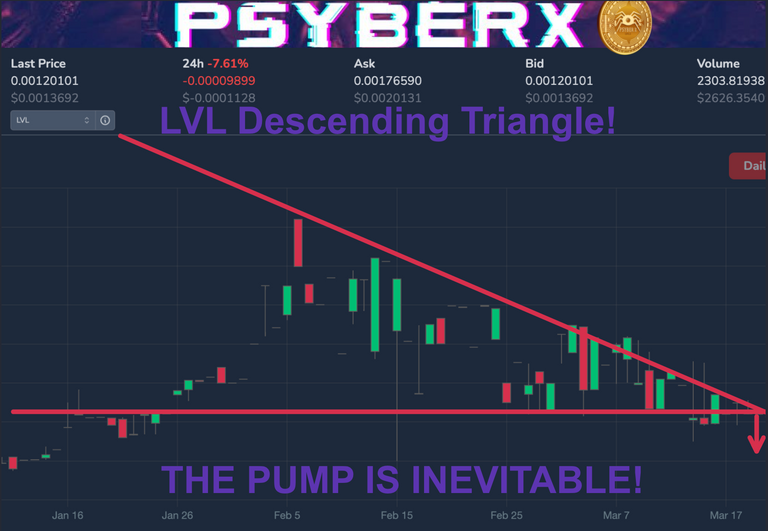
I've seen a lot of charts going around HIVE with triangles, and I noticed one on LVL myself.
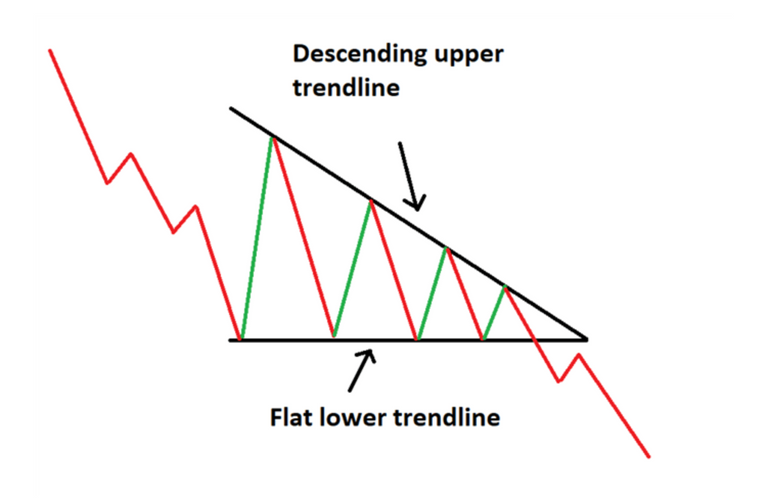
Initially I had a bullish bias, I assumed a triangle and a relatively low price meant it was about to break out and rally higher. However after researching the charts a little bit, and refreshing my memory, I came to the conclusion that this particular triangle is actually classified as a bearish descending triangle, since it has a flat bottom, and a descending downward slope. This descending triangle suggests LVL is about to fall down & out from the triangle, possibly in the final capitulation concluding this bear move!!
See chart below:
 Source: https://www.dailyfx.com/education/technical-analysis-chart-patterns/triangle-pattern.html
When it comes to crypto price predictions, I like to look at the glass half full, especially when I see a bearish pattern.
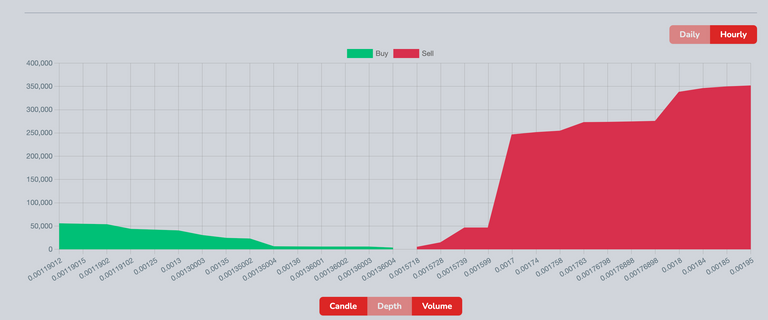
Even though I do hold some LVL at the time of this writing, i'm not worried about the price dropping a little bit more, since another drop will give me longer to stock up big before the next big inevitable pump. I suspect LVL will be pumping again soon enough, especially by May after the marketplace launches. We'll need more FOMO generated from the marketplace launch hype to get us over the hump, and flip this market depth chart below before we can really pump!

This coin looks like a good high probability trade, and the lower it goes the higher the probability of a bounce. My plan is to simply watch this triangle pattern for the capitulation to buy more, but also be ready to recognize when the pattern finally fails with a pre-mature breakout, signaling the end of this long and treacherous downturn for LVL.

