Hello friends of $POB, Friends of $HIVE and all others,
here are the:
$POB Statistics for the last 4 weeks:
The timeframe is from 2023-06-23 to 2023-07-21 (due to my holliday).
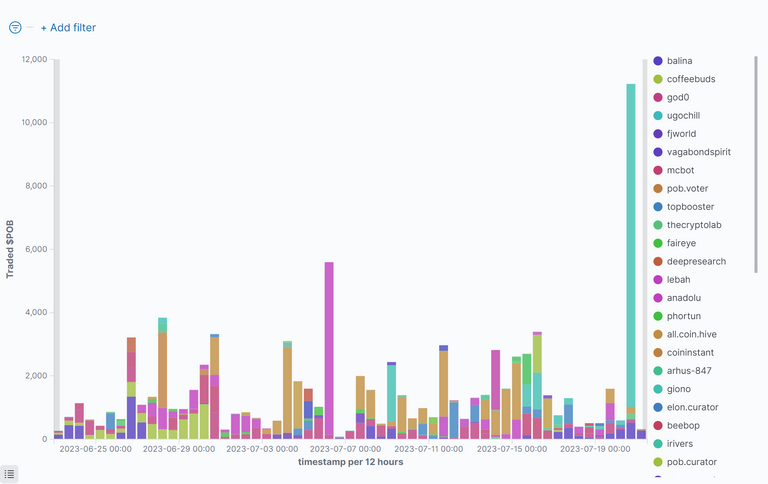
Bought $POB By Time
This figure shows who has bought how many $POB at which time:
Top $POB Buyers and $HIVE Sellers
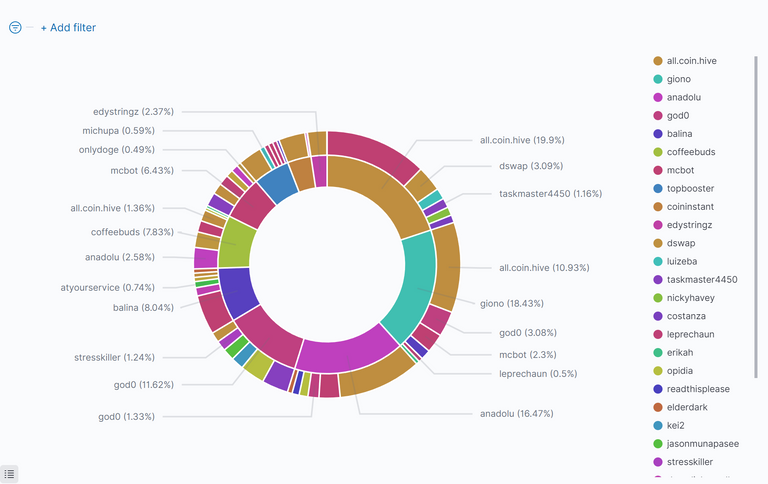
The inside of the circle shows the buyers of $POB, ordered by $HIVE they have spent. The outside shows the recipients of that $HIVE (sellers of $POB):
Commulated Amount Of Bought $POB Per Person
This figure shows the top 10 $POB buyers, how much they got and how much $HIVE they spend for this. It is sorted by $HIVE, that was spent:
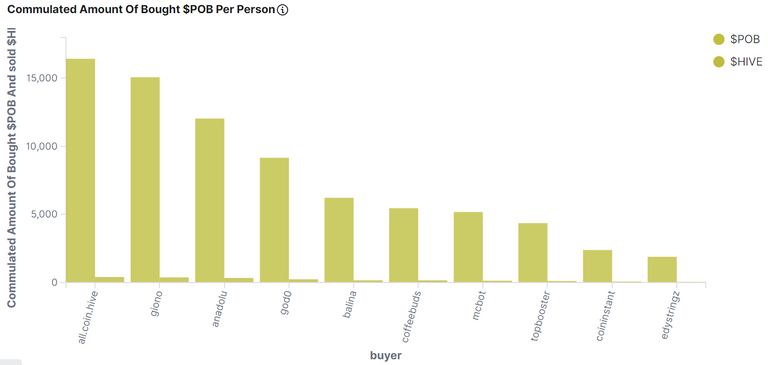
Table Of Top 20 $POB Buyers
This table shows the top ten buyers of $POB sorted by the $HIVE, they have spent:
| Buyer(Descending) | Sold $HIVE | % Sold $HIVE | Bought $POB | Avg. Price | Number of Trades |
|---|---|---|---|---|---|
| @all.coin.hive | 406.51432 | 17.27 % | 16433.42991 | 0.02516 | 196 |
| @giono | 376.57237 | 16.00 % | 15075.55937 | 0.02489 | 131 |
| @anadolu | 336.49787 | 14.30 % | 12041.71969 | 0.02599 | 266 |
| @god0 | 236.75434 | 10.06 % | 9161.21128 | 0.02597 | 672 |
| @balina | 163.32634 | 6.94 % | 6223.04633 | 0.02502 | 253 |
| @coffeebuds | 159.91049 | 6.80 % | 5457.11328 | 0.02911 | 271 |
| @mcbot | 131.42359 | 5.58 % | 5178.94063 | 0.02419 | 104 |
| @topbooster | 110.23529 | 4.68 % | 4360.65747 | 0.02543 | 45 |
| @coininstant | 71.59136 | 3.04 % | 2387.58345 | 0.02989 | 3 |
| @edystringz | 48.47811 | 2.06 % | 1890.00000 | 0.02564 | 2 |
| @onlydoge | 40.20323 | 1.71 % | 1493.87794 | 0.02691 | 25 |
| @fjworld | 32.63272 | 1.39 % | 1200.00000 | 0.02742 | 48 |
| @faireye | 30.45425 | 1.29 % | 1205.08077 | 0.02568 | 114 |
| @mes | 25.00000 | 1.06 % | 1111.11111 | 0.02250 | 24 |
| @darkflame | 23.63086 | 1.00 % | 922.00195 | 0.02759 | 28 |
| @lebah | 21.46427 | 0.91 % | 829.60028 | 0.02824 | 9 |
| @richardcrill | 18.81100 | 0.80 % | 752.72308 | 0.02480 | 5 |
| @thecryptolab | 17.99464 | 0.76 % | 761.83732 | 0.02479 | 97 |
| @deepresearch | 13.62124 | 0.58 % | 459.00000 | 0.02967 | 3 |
| @arhus-847 | 11.28322 | 0.48 % | 441.60732 | 0.02567 | 3 |
| others | 76.87999 | 3.27 % | 4052.13377 | 0.02695 | 246 |
| Sum: | 2353.27950 | 100 % | 91438.23495 | 0.02669 | 2545 |
Commulated Amount Of Sold $POB Per Person
This figure shows the top 10 $POB Sellers, how much they sold and how much $HIVE they got for this, sorted by $HIVE:
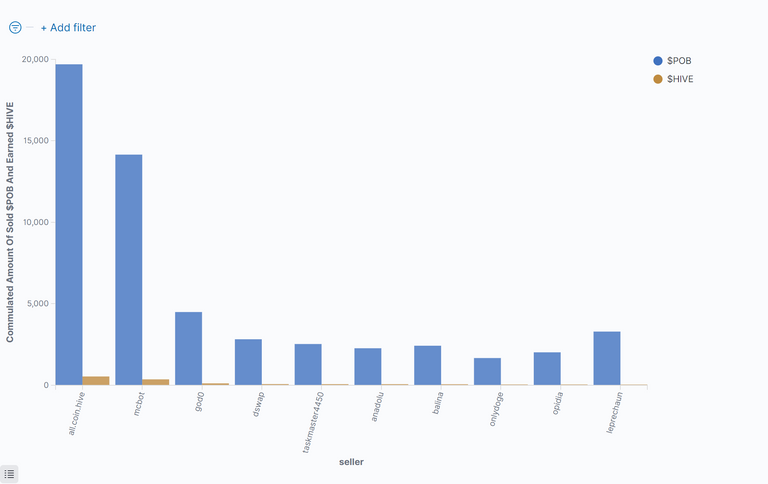
Table Of Top 20 $POB Sellers
This table shows the top ten sellers of $POB Sorted by the $HIVE, they have got:
| Seller(Descending) | Earned $HIVE | % Earned $HIVE | Sold $POB | Avg. Price | Number of Trades |
|---|---|---|---|---|---|
| @all.coin.hive | 539.72908 | 22.94 % | 19697.43125 | 0.02884 | 38 |
| @mcbot | 362.37926 | 15.40 % | 14154.84786 | 0.02638 | 93 |
| @god0 | 116.55976 | 4.95 % | 4493.90681 | 0.02588 | 88 |
| @dswap | 72.18278 | 3.07 % | 2823.16220 | 0.02545 | 84 |
| @taskmaster4450 | 68.51289 | 2.91 % | 2530.84569 | 0.02624 | 9 |
| @anadolu | 67.20533 | 2.86 % | 2271.43334 | 0.02891 | 55 |
| @balina | 62.52313 | 2.66 % | 2426.25791 | 0.02555 | 50 |
| @onlydoge | 50.00061 | 2.12 % | 1670.07782 | 0.03004 | 24 |
| @opidia | 49.89751 | 2.12 % | 2021.51018 | 0.02618 | 29 |
| @leprechaun | 44.39158 | 1.89 % | 3293.96582 | 0.01820 | 22 |
| @kenechukwu97 | 43.84238 | 1.86 % | 1771.25416 | 0.02585 | 25 |
| @michupa | 35.36408 | 1.50 % | 1518.48900 | 0.02512 | 33 |
| @readthisplease | 29.72466 | 1.26 % | 1092.99998 | 0.02799 | 11 |
| @arcange | 25.59123 | 1.09 % | 890.99172 | 0.02852 | 24 |
| @elderdark | 21.40119 | 0.91 % | 813.06520 | 0.02633 | 10 |
| @davedickeyyall | 21.28033 | 0.90 % | 813.99999 | 0.02656 | 6 |
| @luizeba | 18.92202 | 0.80 % | 756.83549 | 0.02505 | 4 |
| @badbitch | 18.73701 | 0.80 % | 735.18750 | 0.02680 | 23 |
| @atyourservice | 18.64698 | 0.79 % | 708.20000 | 0.02693 | 12 |
| @beemd | 18.41069 | 0.78 % | 711.85924 | 0.02709 | 31 |
| others | 667.97710 | 28.38 % | 26241.91374 | 0.02591 | 1874 |
| Sum: | 2353.27960 | 100 % | 91438.23490 | 0.02594 | 2545 |
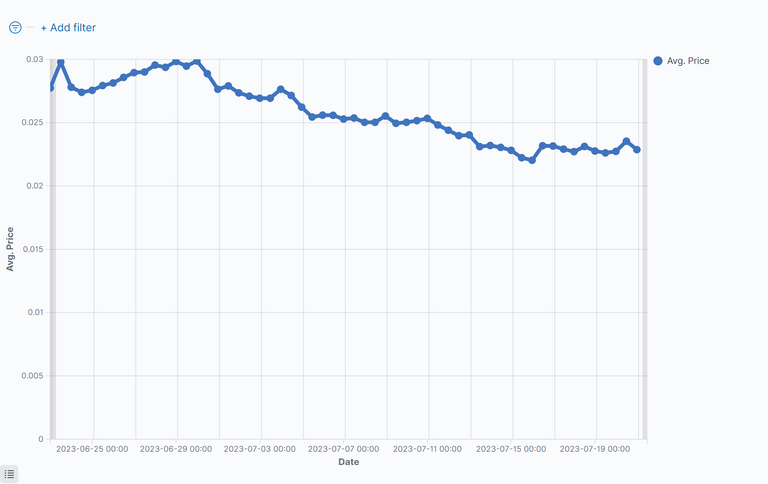
Price of the $POB
This figure shows the price of $POB for the last period:
$POB Summarize Metrics
This table shows how much $HIVE was given by buy-requests, that where equal or higher than the sell order vs. sell-requests, that were equal or lower than the buy order.
If the buy-requests where higher than the sell-requests, then money comes into the system and the value of the token increases.
Under the total line one can see the sum of $HIVE and sum of $POB that changed the ownership and the average price of $POB for the last period.
| Request | Received Hive | Received HIVE % | Sold $POB | Avg. Price |
|---|---|---|---|---|
| sell | 1392.89696 | 59.19% | 56154.36148 | 0.02566 |
| buy | 960.38256 | 40.81% | 35283.87346 | 0.02720 |
| sum: | 2353.27952 | 100% | 91438.23494 | 0.02643 |
Comparison With Other Tokens
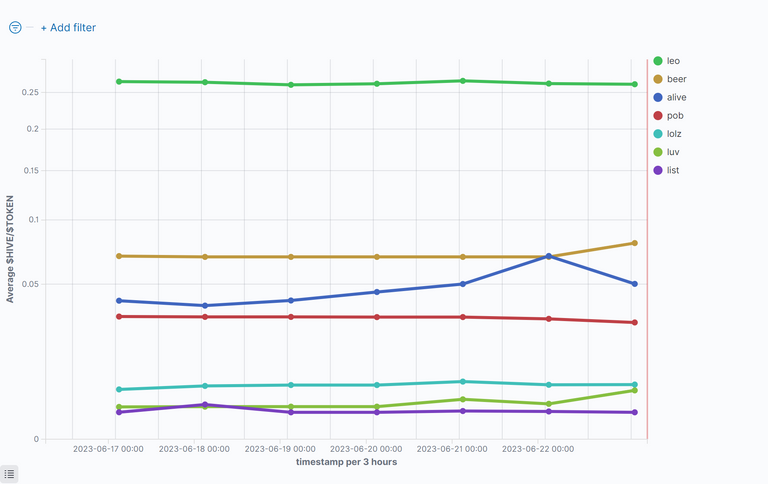
$HIVE/Token
This figure shows the value of $HIVE compared to some token for the last period. Be aware of the nonlinear (root square) y-axes.
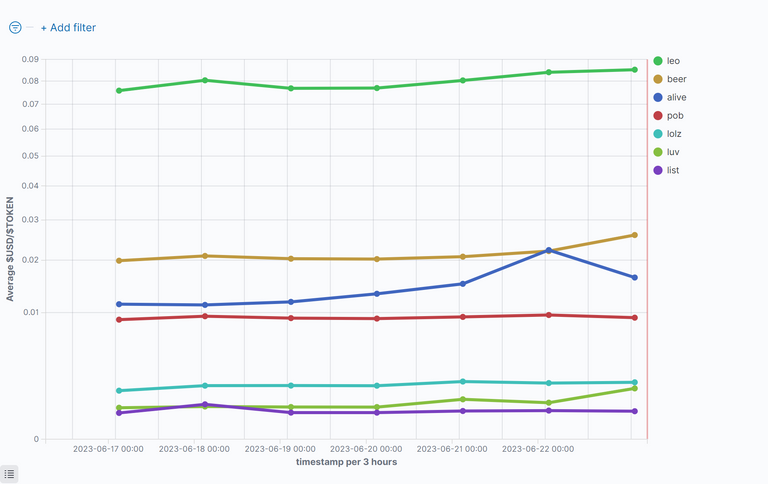
US-Dollar/Token
This figure shows the value of $USD compared to some token for the last period. Be aware of the nonlinear (root square) y-axes.
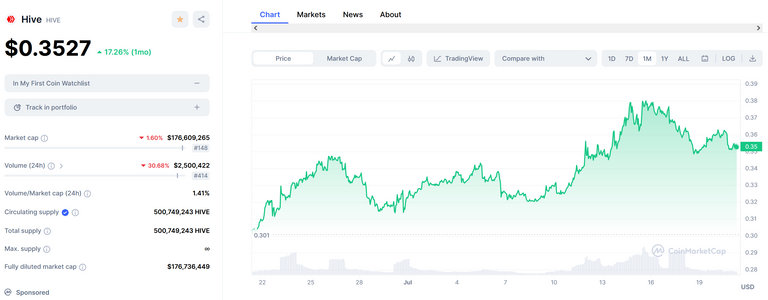
The HIVE rank in Coinmarktecap is: 148
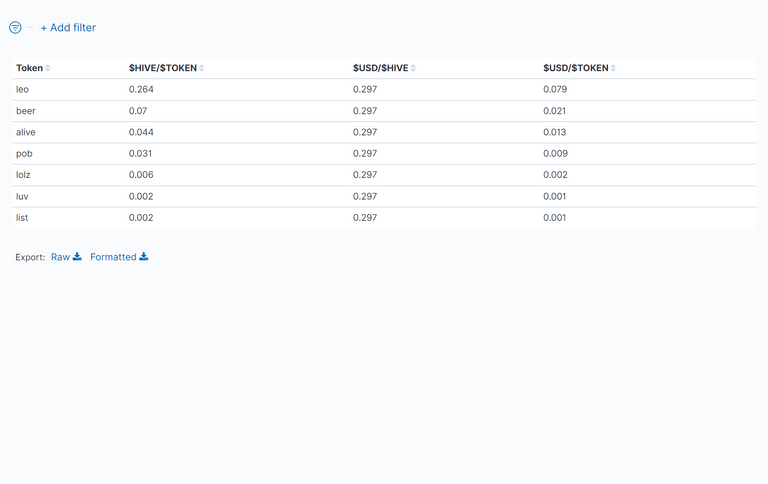
Table Of Token Prices in $HIVE and $USD
This table shows the average value of the prices of the token for the last period. One can see Hive and the US-Dollar compared to the token.
Disclaimer
All stats are without warranty.
They are taken from:
curl -XPOST -H "Content-type: application/json" -d '{ "jsonrpc": "2.0", "method": "find", "params": { "contract": "market", "table": "tradesHistory", "query": { "symbol": "TOKEN"}, "limit":1000, "offset": 0 }, "id": 1 }' 'https://api.hive-engine.com/rpc/contracts'
I have put them into logfiles and uploaded them to Kibana, from which I took the screenshots.
If you find errors, please tell me!
If you want me to continue the stats, give me some good upvotes ;-)
If you want to see other statistics (even from totaly other data), please contact me. I can create them weekly or monthly if I get some rewards for it.
For more details see here: How I Have Set Up Elasticsearch And Kibana On My Raspberry Pi To Monitor Token Activities and here: Do You Want To See Statistics Of Your Favorite HIVE Token? or on github.
Here are the stats from the other tokens I observe: https://peakd.com/@achimmertens/posts?filter=stats
Regards, Achim Mertens
