Good day Hiveians!
Join me in analyzing the crypto markets!
3 weeks ago we talked about the moon cycle - bitcoin connection
The idea is that Bitcoin goes down in a full moon phase and goes up in a new moon phase. The new moons are marked in red and the full moons in blue. This is the chart from last time:
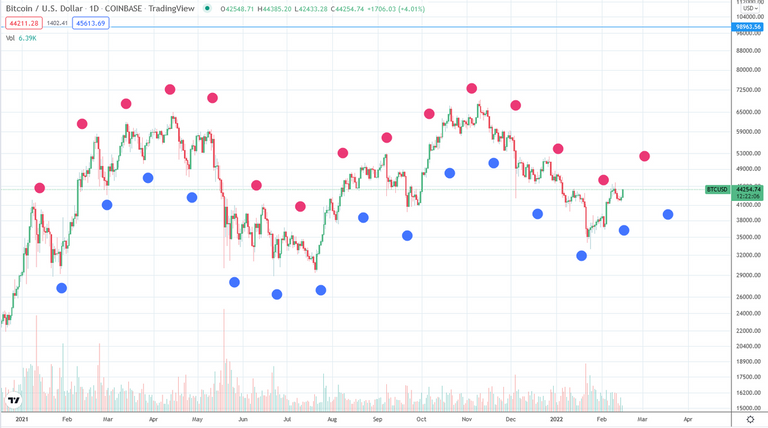
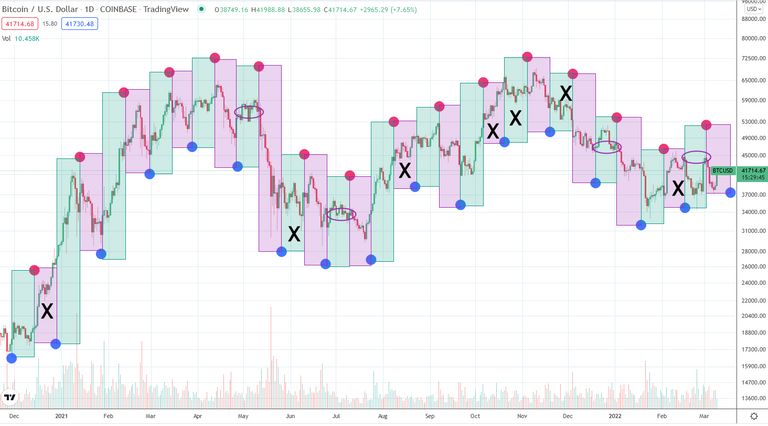
We can make it a bit more easy to read the cycles if we also add some red and green areas for each phase. Here is a slightly lengthened chart which starts on November 29th 2021 and goes up to the present:
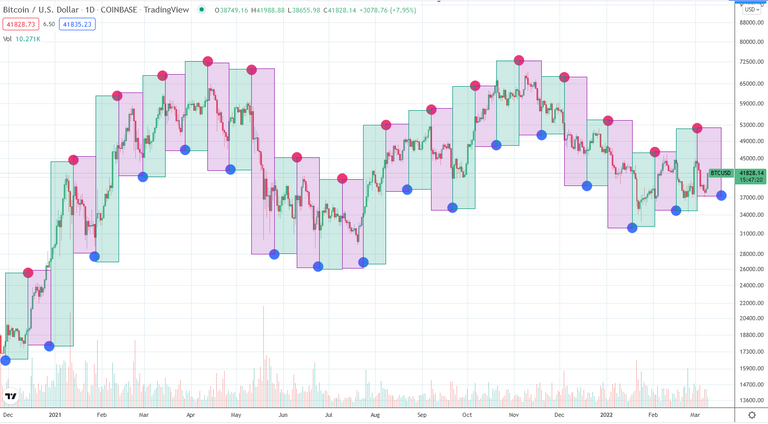
Prices should go up for the green areas and down for the red areas. Now comes the test: How often did that actually happen?
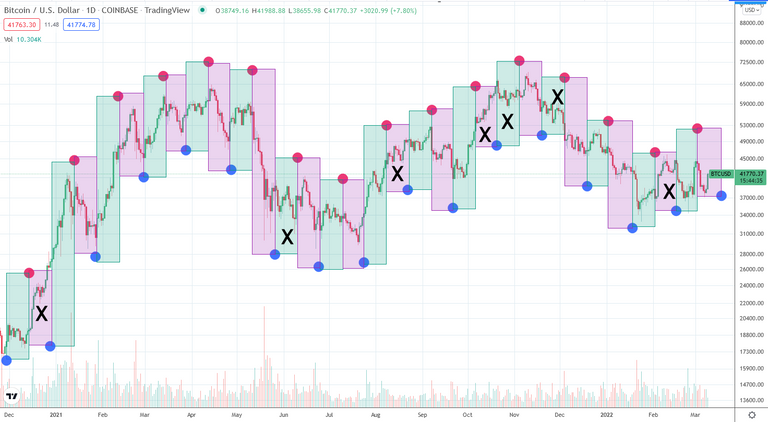
The Xs mark the areas for which that did not hold true. As we can see this happened 7 times. Last time we calculated the success rate for a shorter time frame of 11 areas:
But so far this technique has successfully predicted a future price trend over 70% of the times (the correct areas and Xs in this chart 11/3=0.27%; and 1-0.27=~73%), so we should definitely keep this tool available.
We got a 73% success rate for that time period. Now let's do that for the extended time frame from above. We have 31 moon phases starting on November 29th 2021. Of these there were 7 which were misses, i.e., price went up when the phase would have predicted it to go down and vice versa. This gives us a stunning success rate of 24 / 31 = 77% Pure chance would get this right half of the time, so 50%. This means that the success rate is 27% above chance! This is a huge deal frankly. I actually don't know of any method that accurately predicts price trends so well... Do you?
What this means is that essentially you could start using this method for making money... Just place orders according to the moon phases and you will probably (77% of the time) get it right! Of course the caveat is that this the success rate is made in hindsight. There is no guarantee that the the 77% will remain constant! Nevertheless, this is really an amazing result...Especially if we only look at the green areas. Here we have only 3 out of 16 that were "wrong". That means there would be a ~82% success rate.
We should also note that quite often price actually went in the right direction with a delay of about 3-4 days. This is marked here in the vertical ovals:
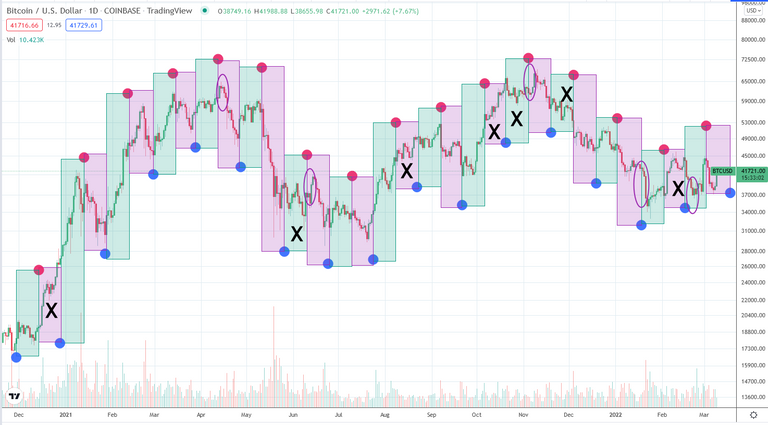
On other occasions the price prediction came true only very narrowly. This is marked here with the horizontal ovals:
As a general reminder: Please keep in mind that none of this is official investment advice! Crypto trading entails a great deal of risk; never spend money that you can't afford to lose!


Check out the Love The Clouds Community if you share the love for clouds!
