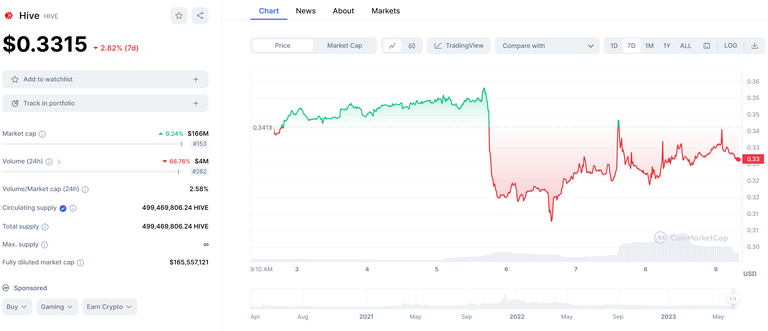
Hello friends of $POB, Friends of $HIVE and all others,
here are the:
$POB Statistics for the last week:
The timeframe is from 2023-06-02 to 2023-06-09.
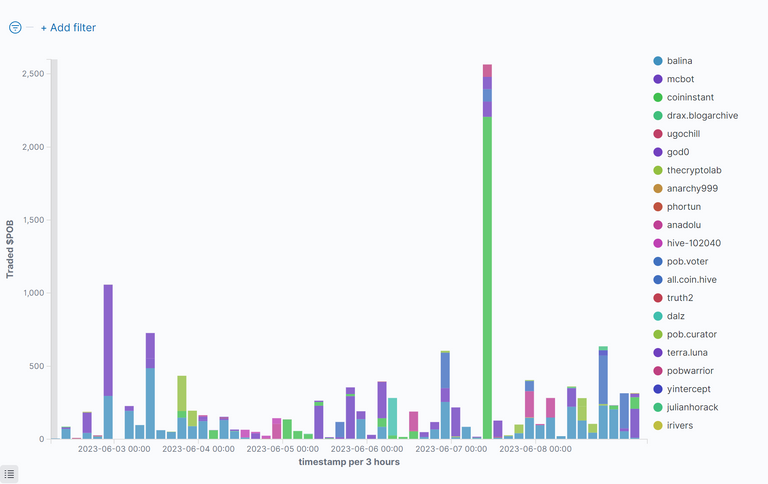
Bought $POB By Time
This figure shows who has bought how many $POB at which time:
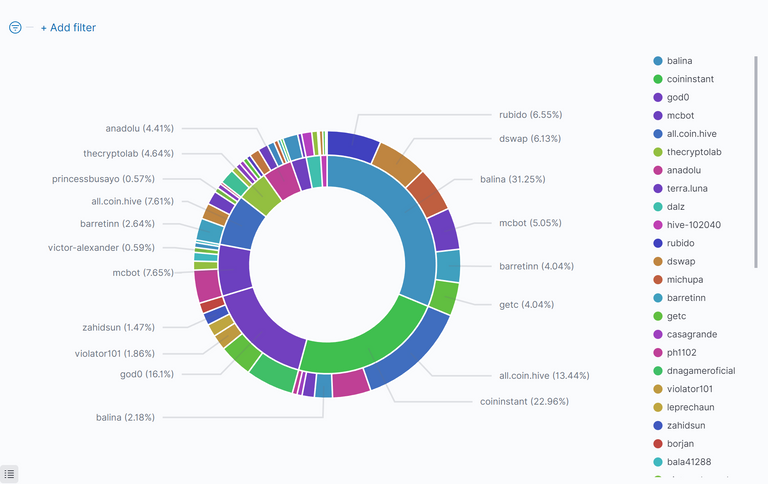
Top $POB Buyers and $HIVE Sellers
The inside of the circle shows the buyers of $POB, ordered by $HIVE they have spent. The outside shows the recipients of that $HIVE (sellers of $POB):
Commulated Amount Of Bought $POB Per Person
This figure shows the top 10 $POB buyers, how much they got and how much $HIVE they spend for this. It is sorted by $HIVE, that was spent:
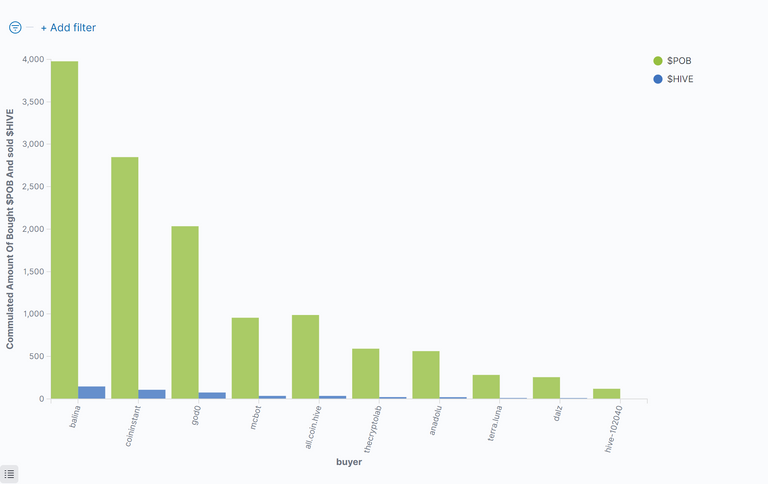
Table Of Top 20 $POB Buyers
This table shows the top ten buyers of $POB sorted by the $HIVE, they have spent:
| Buyer(Descending) | Sold $HIVE | % Sold $HIVE | Bought $POB | Avg. Price | Number of Trades |
|---|---|---|---|---|---|
| @balina | 147.27634 | 30.39 % | 3990.11015 | 0.03676 | 212 |
| @coininstant | 107.86489 | 22.26 % | 2848.62431 | 0.03734 | 65 |
| @god0 | 75.63917 | 15.61 % | 2034.47242 | 0.03682 | 193 |
| @mcbot | 35.91830 | 7.41 % | 956.46782 | 0.03767 | 28 |
| @all.coin.hive | 35.73467 | 7.37 % | 988.74789 | 0.03674 | 17 |
| @thecryptolab | 21.80478 | 4.50 % | 591.91271 | 0.03651 | 60 |
| @anadolu | 20.73279 | 4.28 % | 563.10280 | 0.03698 | 27 |
| @terra.luna | 10.82151 | 2.23 % | 282.96313 | 0.03828 | 3 |
| @dalz | 10.00000 | 2.06 % | 256.46445 | 0.03897 | 5 |
| @hive-102040 | 4.48720 | 0.93 % | 119.65856 | 0.03750 | 16 |
| @pob.voter | 3.30409 | 0.68 % | 84.74792 | 0.03834 | 3 |
| @pobwarrior | 3.29999 | 0.68 % | 84.61543 | 0.03900 | 2 |
| @pob.curator | 2.93663 | 0.61 % | 80.69872 | 0.03652 | 6 |
| @yintercept | 1.30711 | 0.27 % | 36.25015 | 0.03606 | 1 |
| @ugochill | 1.12853 | 0.23 % | 29.00000 | 0.03892 | 7 |
| @julianhorack | 1.01223 | 0.21 % | 27.00000 | 0.03749 | 1 |
| @drax.blogarchive | 0.74100 | 0.15 % | 19.44891 | 0.03818 | 7 |
| @anarchy999 | 0.30845 | 0.06 % | 8.18213 | 0.03804 | 3 |
| @irivers | 0.14440 | 0.03 % | 4.00000 | 0.03610 | 1 |
| @truth2 | 0.10000 | 0.02 % | 2.57069 | 0.03890 | 1 |
| others | 0.09913 | 0.02 % | 2.68635 | 0.05551 | 4 |
| Sum: | 484.66121 | 100 % | 13011.72454 | 0.03919 | 662 |
Commulated Amount Of Sold $POB Per Person
This figure shows the top 10 $POB Sellers, how much they sold and how much $HIVE they got for this, sorted by $HIVE:
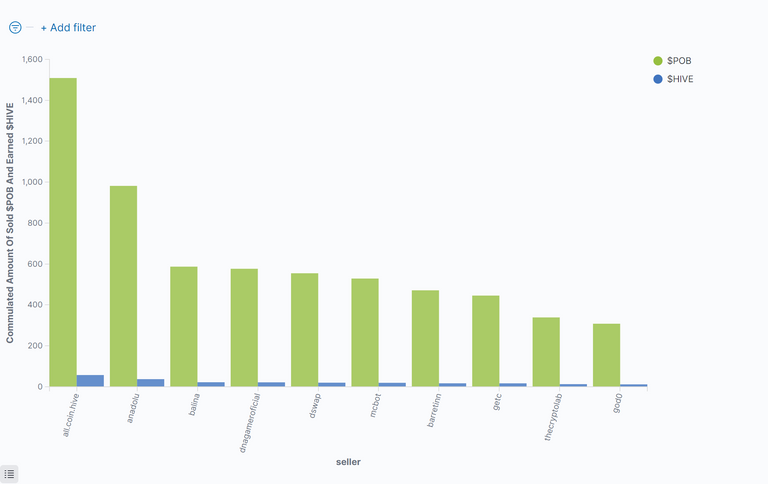
Table Of Top 20 $POB Sellers
This table shows the top ten sellers of $POB Sorted by the $HIVE, they have got:
| Seller(Descending) | Earned $HIVE | % Earned $HIVE | Sold $POB | Avg. Price | Number of Trades |
|---|---|---|---|---|---|
| @all.coin.hive | 57.35651 | 11.83 % | 1508.86817 | 0.03850 | 2 |
| @anadolu | 37.29198 | 7.69 % | 981.75772 | 0.03790 | 8 |
| @balina | 22.20743 | 4.58 % | 587.08037 | 0.03835 | 17 |
| @dnagameroficial | 21.72963 | 4.48 % | 576.66415 | 0.03768 | 10 |
| @dswap | 19.98778 | 4.12 % | 554.70260 | 0.03625 | 19 |
| @mcbot | 19.34930 | 3.99 % | 528.88386 | 0.03650 | 5 |
| @barretinn | 16.96976 | 3.50 % | 471.34282 | 0.03601 | 5 |
| @getc | 16.78992 | 3.46 % | 445.65538 | 0.03767 | 5 |
| @thecryptolab | 12.94127 | 2.67 % | 338.91594 | 0.03863 | 10 |
| @god0 | 11.90343 | 2.46 % | 308.13376 | 0.03859 | 9 |
| @violator101 | 10.37582 | 2.14 % | 275.00135 | 0.03773 | 5 |
| @casagrande | 9.06560 | 1.87 % | 244.21226 | 0.03720 | 4 |
| @kenechukwu97 | 8.80255 | 1.82 % | 242.21165 | 0.03645 | 5 |
| @bala41288 | 8.15436 | 1.68 % | 225.25455 | 0.03620 | 2 |
| @rubido | 8.11308 | 1.67 % | 215.02537 | 0.03773 | 2 |
| @michupa | 7.87419 | 1.62 % | 212.04198 | 0.03709 | 4 |
| @princessbusayo | 7.30131 | 1.51 % | 200.00000 | 0.03651 | 2 |
| @beemd | 6.99559 | 1.44 % | 190.42197 | 0.03643 | 6 |
| @elderdark | 6.57593 | 1.36 % | 176.34218 | 0.03729 | 4 |
| @srleorio | 5.79893 | 1.20 % | 148.72908 | 0.03899 | 2 |
| others | 169.07686 | 34.89 % | 4580.47943 | 0.03707 | 536 |
| Sum: | 484.66123 | 100 % | 13011.72459 | 0.03710 | 662 |
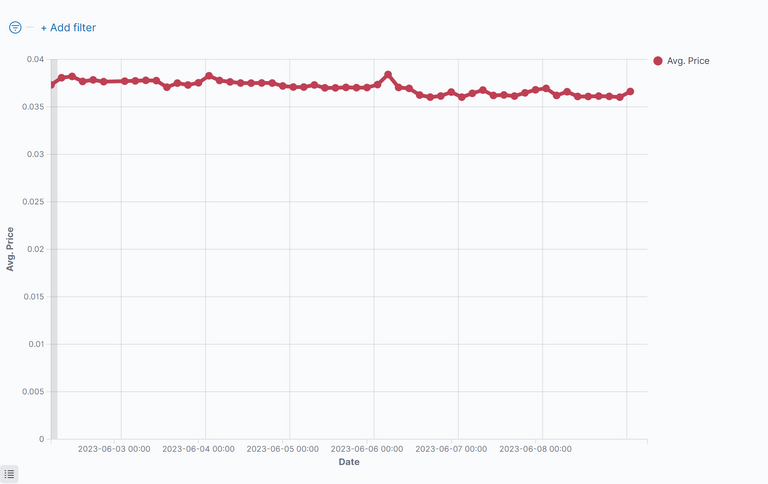
Price of the $POB
This figure shows the price of $POB for the last period:
$POB Summarize Metrics
This table shows how much $HIVE was given by buy-requests, that where equal or higher than the sell order vs. sell-requests, that were equal or lower than the buy order.
If the buy-requests where higher than the sell-requests, then money comes into the system and the value of the token increases.
Under the total line one can see the sum of $HIVE and sum of $POB that changed the ownership and the average price of $POB for the last period.
| Request | Received Hive | Received HIVE % | Sold $POB | Avg. Price |
|---|---|---|---|---|
| sell | 295.71899 | 61.02% | 8021.28420 | 0.03681 |
| buy | 188.94224 | 38.98% | 4990.44036 | 0.03782 |
| sum: | 484.66123000000005 | 100% | 13011.724559999999 | 0.03732 |
Comparison With Other Tokens
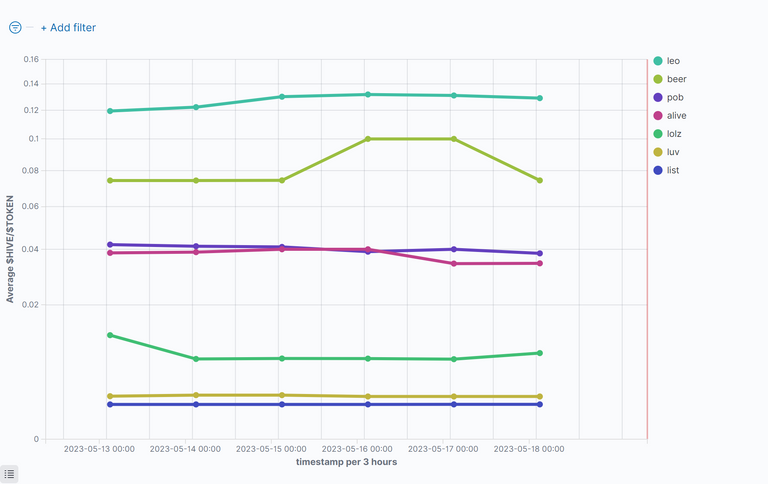
$HIVE/Token
This figure shows the value of $HIVE compared to some token for the last period. Be aware of the nonlinear (root square) y-axes.
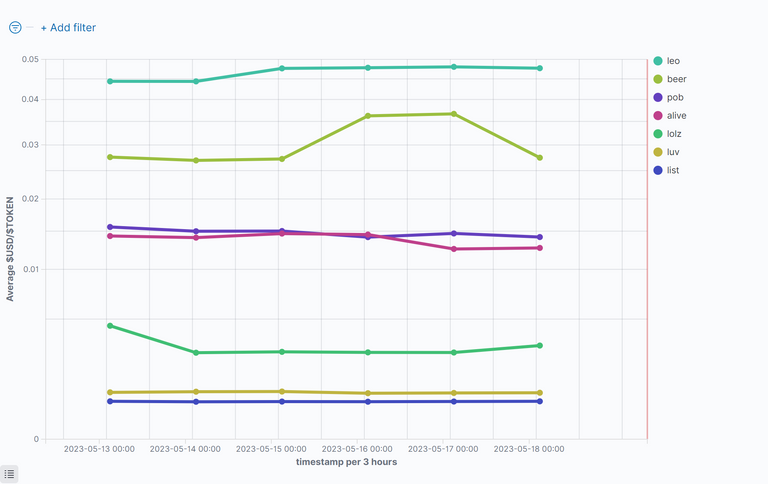
US-Dollar/Token
This figure shows the value of $USD compared to some token for the last period. Be aware of the nonlinear (root square) y-axes.
The HIVE rank in Coinmarktecap is: 165
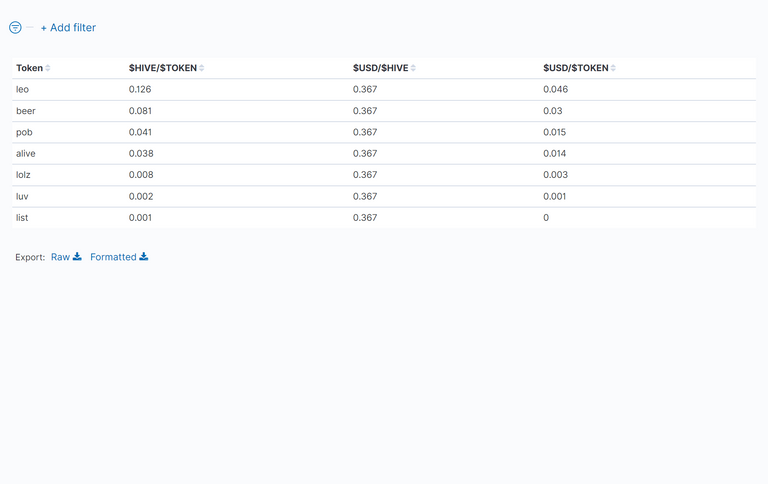
Table Of Token Prices in $HIVE and $USD
This table shows the average value of the prices of the token for the last period. One can see Hive and the US-Dollar compared to the token.
Disclaimer
All stats are without warranty.
They are taken from:
curl -XPOST -H "Content-type: application/json" -d '{ "jsonrpc": "2.0", "method": "find", "params": { "contract": "market", "table": "tradesHistory", "query": { "symbol": "TOKEN"}, "limit":1000, "offset": 0 }, "id": 1 }' 'https://api.hive-engine.com/rpc/contracts'
I have put them into logfiles and uploaded them to Kibana, from which I took the screenshots.
If you find errors, please tell me!
If you want me to continue the stats, give me some good upvotes ;-)
If you want to see other statistics (even from totaly other data), please contact me. I can create them weekly or monthly if I get some rewards for it.
For more details see here: How I Have Set Up Elasticsearch And Kibana On My Raspberry Pi To Monitor Token Activities and here: Do You Want To See Statistics Of Your Favorite HIVE Token? or on github.
Here are the stats from the other tokens I observe: https://peakd.com/@achimmertens/posts?filter=stats
Regards, Achim Mertens
