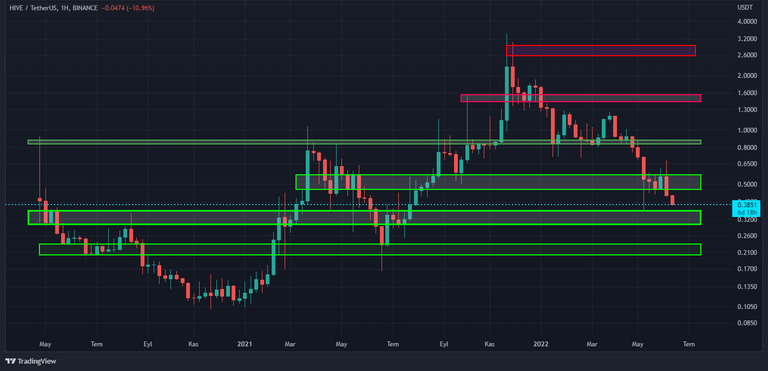
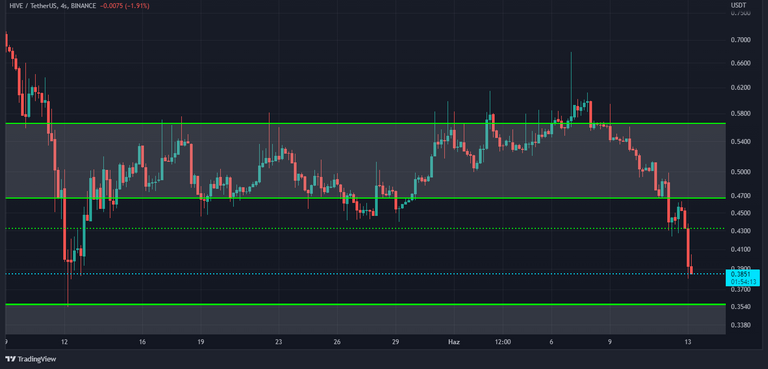
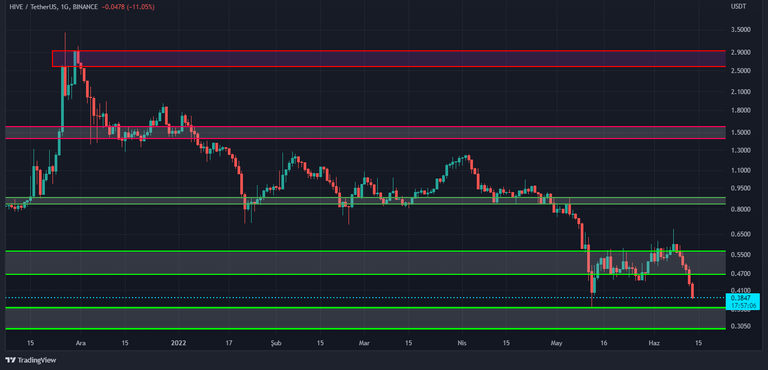
Hello again. I haven't been posting for a long time. I will continue to share. I wanted to start over with Hive analysis. I shared the last Hive analysis in February. Hive was worth $1 when I posted the chart. It is currently valued at $0.38. It's time to update the graphics. But I will not make a new drawing. I will comment on the regions I marked earlier. I am attaching the graphics below. I will upload weekly, daily and four hourly screenshots respectively.


Above is a supply-demand zone of 0.47-0.57 cents. Above, a resistance level at 0.85 cents awaits us. Below is a supply-demand zone in the range of 0.35-0.30. Further down, there is a resistance zone at 0.2 cent price.
Hive graphics that I shared before;
https://peakd.com/hive-167922/@anadolu/current-hive-graphics-ded44f500b8fe
This is not a bullish-bearish signal. And this post is not investment advice. You should make your investment decisions yourself according to your psychological state and your financial situation. It would be more helpful to see this sharing as an educational work. See you.
Posted Using LeoFinance Beta
