Bitcoin price went down from 67K to 60K. I shared lots of analysis about possible price drop on Bİtcoin price chart and It happened. This is only the beginning. Bitcoin rested 61K during price drop and 2nd part of price drop is coming soon.
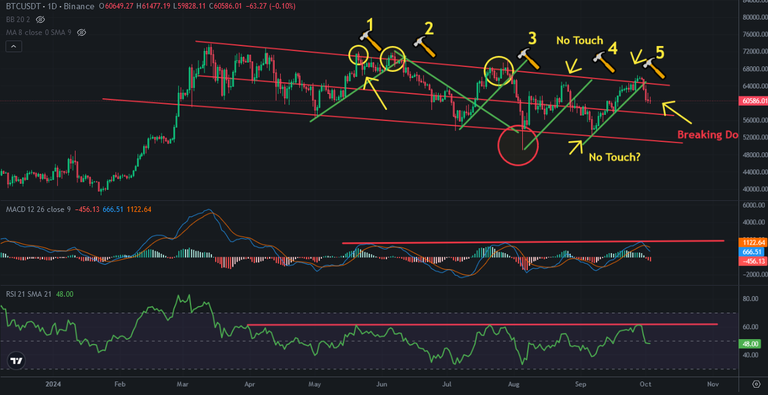
Here you can see daily chart of Bitcoin price. Bitcoin has not touched any support line. There is support line which is the middle line of descending channel. It is the first srop during price drop. It may support Bitcoin price. First support is at 57K. We may see if we want to invest crypto.
You can see great resistances on daily chart of Bitcoin. MACD and RSI Indicator have great resistances..
When I look altcoins price chart, price drops may continue. They are at high level from the bottom. They need to go down. So, Bitcoins price drop will support this price drop..
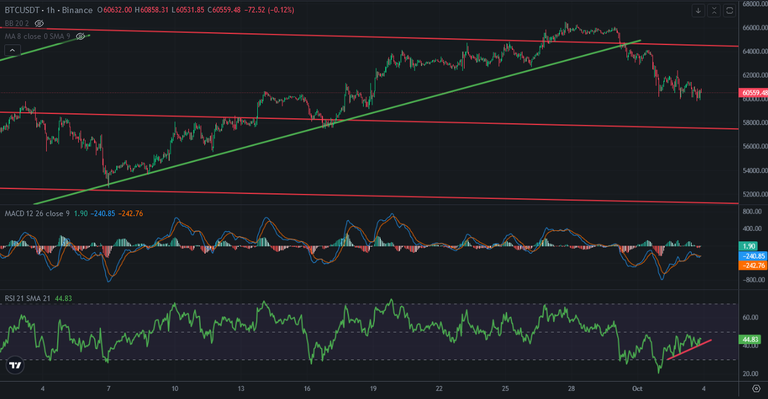
Here you can see 1-hour Bitcoin price chart and there is uptrend line on RSI Indicator. Even It goes up, price is going down. We can see price drop when it breaks down. It may go down where I said. I am waiting for 57K to buy crypto. It is so close..
I think the middle line of descending channel is great support and It will support Bitcoins price. If not, we may see all time low some of altcoins..
We will see..
Posted Using InLeo Alpha