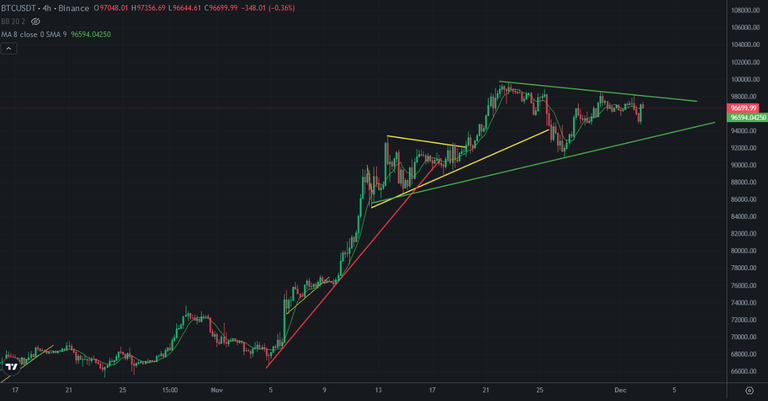
Bitcoin price is in price correction period after touchin 99K. It was early to break up 100K. So, Bitcoin price is trying to get power to break 100K. It is major level for Bitcoin price. Lots of news will be released after breaking 100K. Bitcoin will get more hype after this level.
So, Bitcoin is trying to get ready to break up this major resistance!
Here you can see 4-hour chart of Bitcoin. There are down and supoort lines on Bitcoin price chart. Bitcoin price stucked into this lines. I drew them as green. There are also yellow lines on Bitcoin price chart. Bitcoin broke up this resistance and You can see what happened after breaking up this resistance.
So, Bitcoin price may break up downtrend line after completing price correction. It will be big flag pattern. We may see huge price moves on Bitcoin price chart after breaking up this resistance.
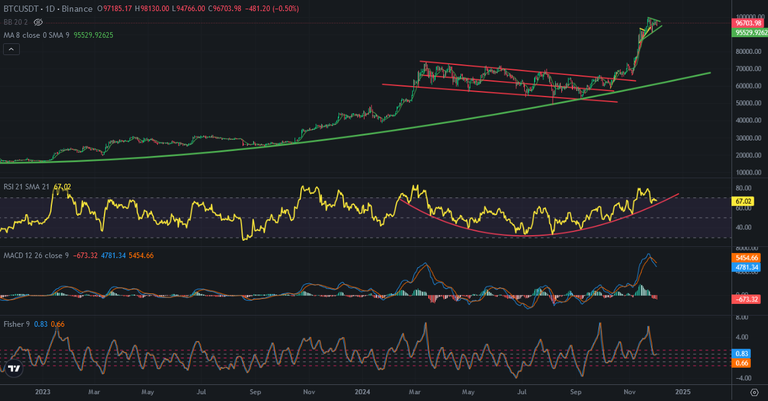
Even there is bullish scenarios on Bitcoin price chart. You can see daily chart of Bitcoin below. There is bowl pattern on RSI Indicator. Bitcoin may break down this pattern in this month. We may see big price correction on Bitcoin price chart if it is broken down.
I shared a few analysis about possible big price correction on Bitcoin price chart. I think we will see it in this month. Even lots of investors are waiting for 100K, market maker likes showing fake moves. This may be one of them.
So, December will be volatiliy month for Bitcoin price chart.
We should follow green lines. If Bitcoin breaks up downtrend line, we should flow in market. If not, we should flow in cash.
We will see..
Posted Using InLeo Alpha


