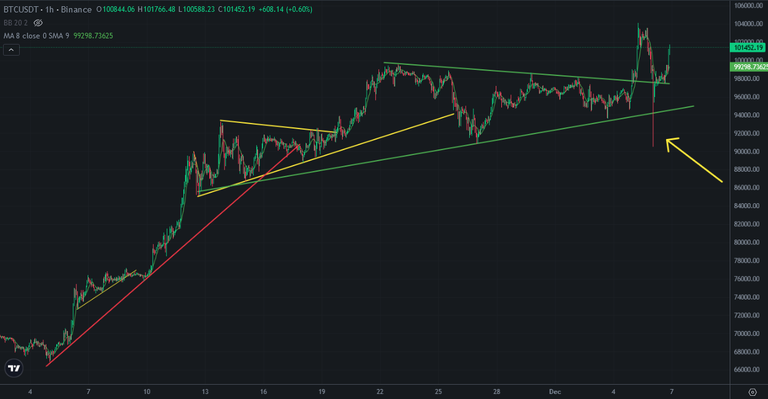
Bitcoin Price went down fast from 104K to 90K. 90K was a fake move and bearish trap. After price correction Bitcoin price went up to 98K to retest flag pattern. It is confirmation of bullish move of Bitcoin price.
Here you can see hourly chart of Bitcoin. I shared this draft a few days ago. Bitcoin made a bearish trap while going down to 90K. So, It is time to see more ATH on Bitcoin price chart.
So, market maker killed all long investors.
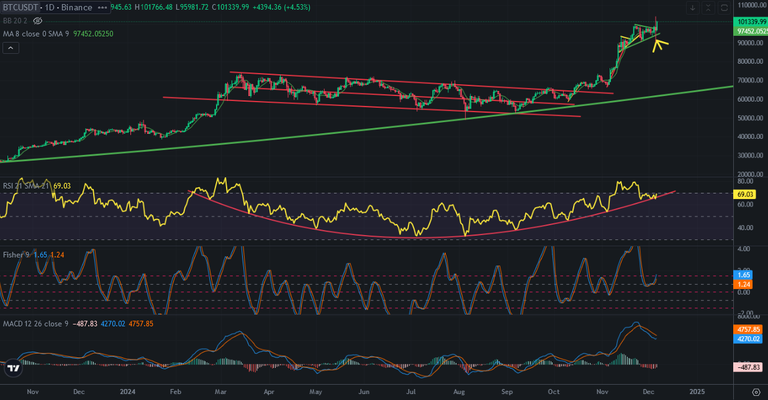
There is great bowl pattern Bitcoin price chart. Here you can see daily chart of Bitcoin. There is great bowl pattern on RSI Indicator. After going down, Bitcoin touched this pattern as a supoort. We will see last bullish attack on Bitcoin price chart. This pattern will be broken down in a few days. We will enter new pattern. So, we should be careful after these days.
MACD Indicator is at all time high level. It needs correction. So, It may take long time. After breaking down of RSI Indicator we will see corrections all indicators of Bitcoin.
You can see Fisher Indicator going up. It will reverse down in a few days. It will be correction of breaking down of RSI Indicators great bowl pattern.
As I said, we should be careful. We will see price correction on Bitcoin price chart until Christmas.
We will see..
Posted Using InLeo Alpha

