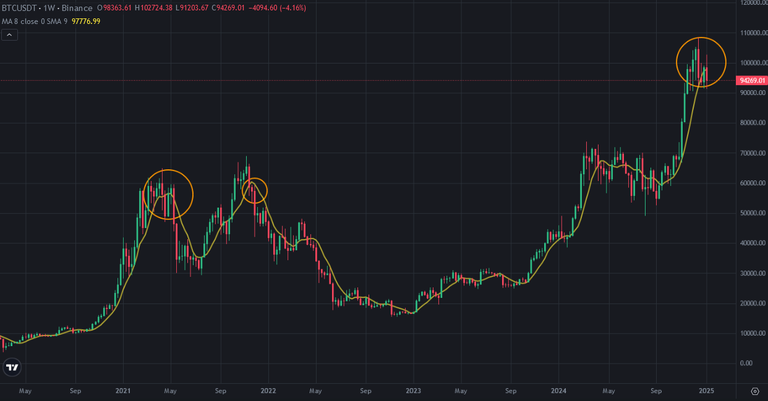
Today is the last day of the week. It is so important. Because Bitcoin price may close this week below 8-week moving average which shows us mid-longterm trend. After closing 8-week moving average we may see huge price drops on crypto market and Bitcoin price chart.
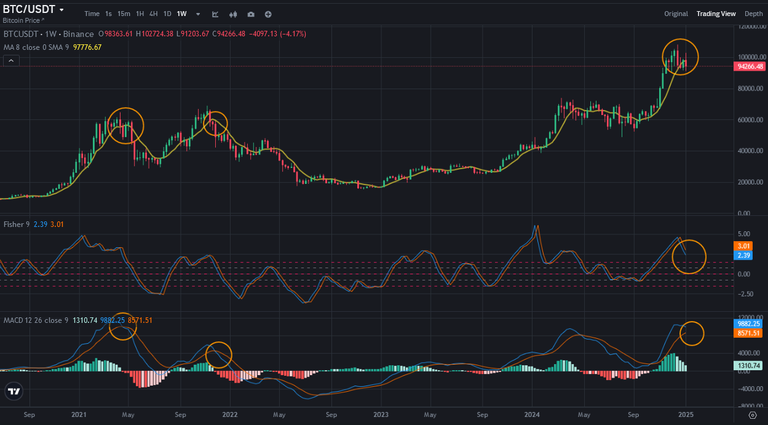
Here you can see weekly chart of Bitcoin. I circled the similarities between 2021 and now. After bullish trend above 8-week movng average, The second weekly close below 8-week moving average may be the beginning of midterm down trend. We have seen this scenario in 2021 for 2 times.
In first bullish run in 2021, Bitcoin price closed 8-week moving average and went up above this average in a week. After closing 2nd times below this average, Bitcoin price got huge red candles in weekly chart.
You can see the same scenario at the end of 2021. You can see what happened after closing 8-week moving average in 2nd times.
When we look at the indicator, we can see something huge coming to us. MACD Indicator is close to reverse down. This is major signal of bearish trend. You can see what happened after reversing down. Fisher Indicator also reversed from the top and it is going down..
So, we may see huge weekly red candles in a few weeks! We should be ready for this price move..
I am also waiting for global crash as 4th August 2024 in this month. Something huge coming for us.
We will see..
Posted Using INLEO


