It is First Time 8 Red Weekly Successive Candles in Bitcoin Price Chart

in #hive-1679223 years ago

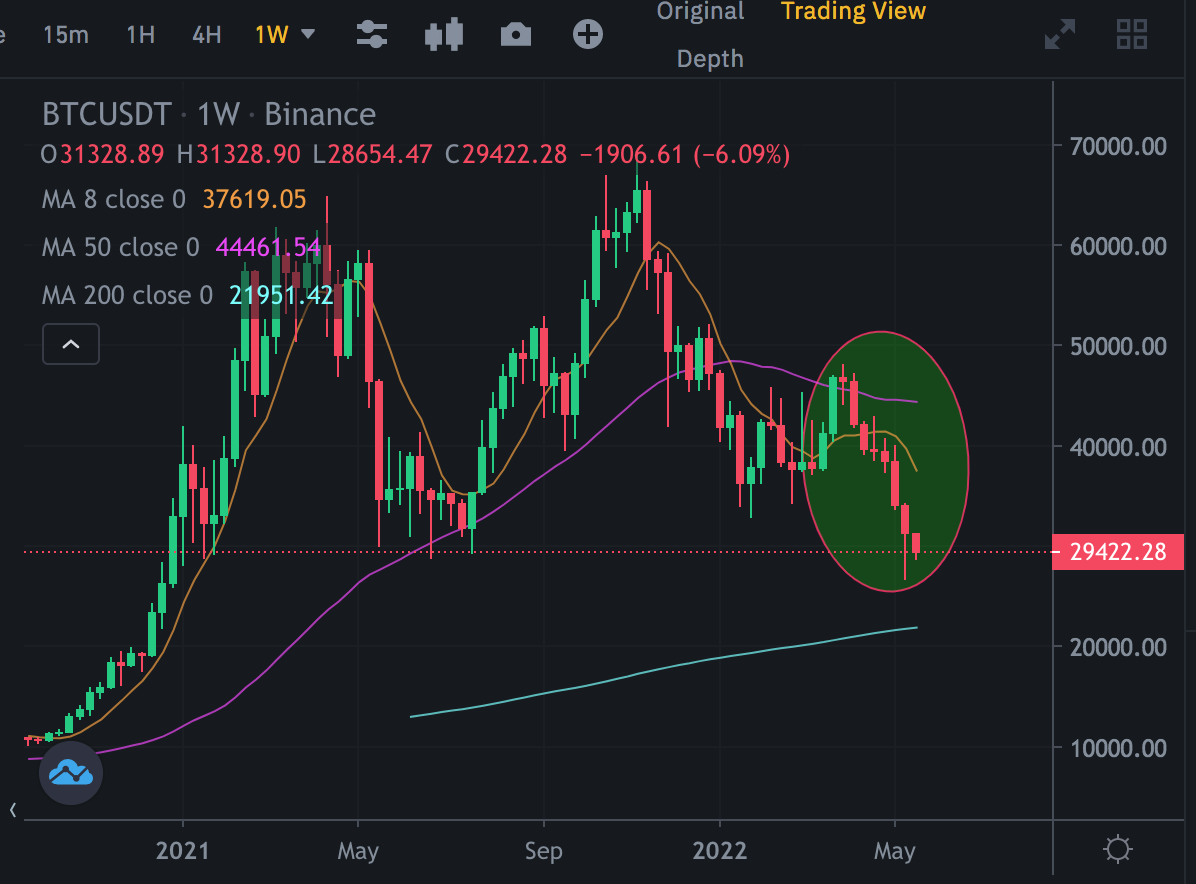
Impossible is nothing. How many people could guess that There would be 8 red weekly successive candles in Bitcoin price chart?

Bitcoin surprised us all.. Noone can say certain about Bitcoin price. I can not say certain that we will not see 9th red candle next week.
Ekran Resmi 20220522 00.16.53.png

It may be time to horizantal market. After 8 or 9 red weekly candle, bitcoin price may stay in horizantal line...

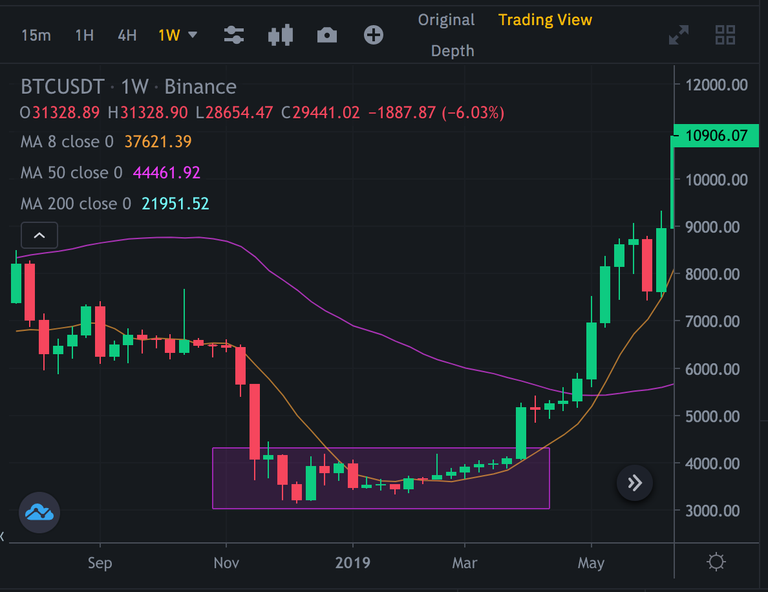
We saw same move at end of 2018. Bitcoin price is in accumulation zone now. It may It may take 5-6 months..
Ekran Resmi 20220522 00.28.22.png

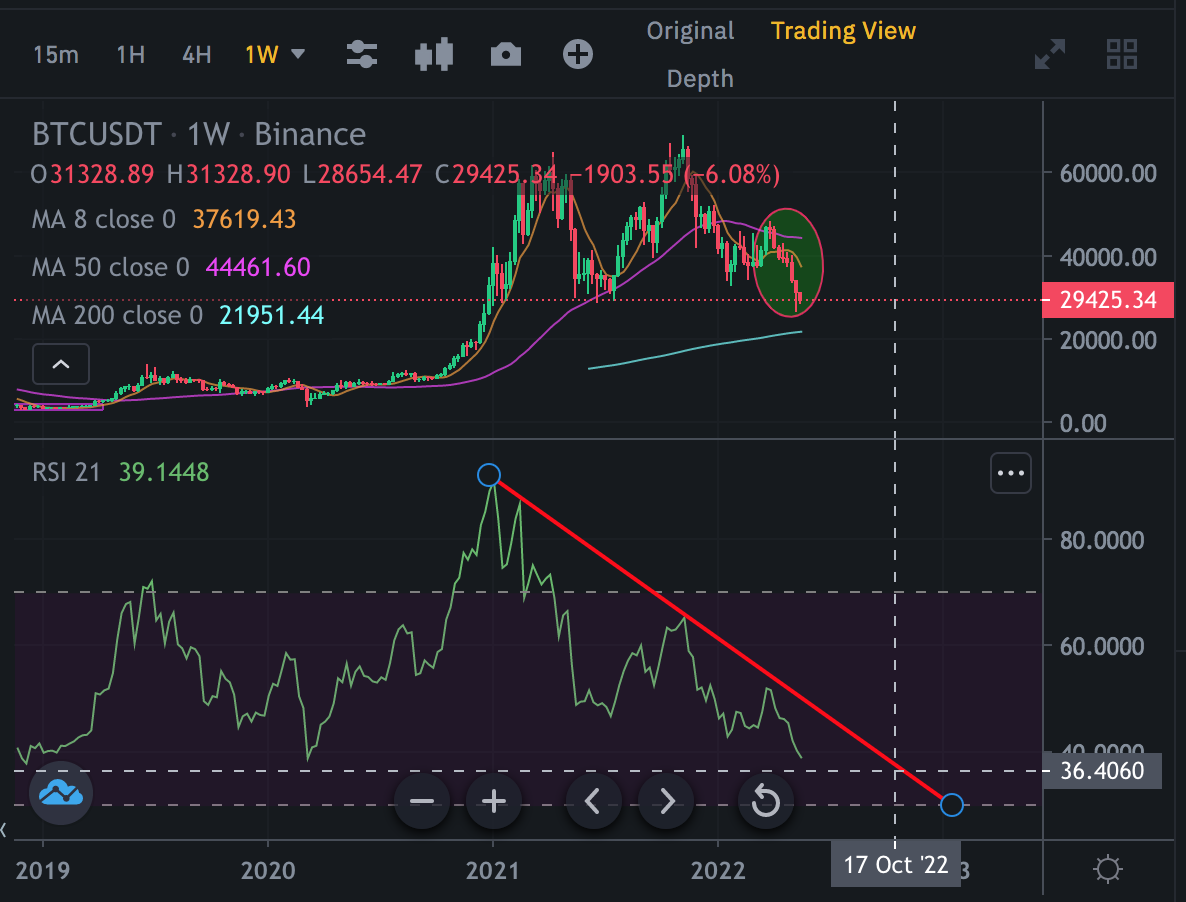
Here is weekly RSI Indicator. It show us it will be broken up in October?

Accumulation will take long time. Summer may be stable for Bitcoin price...
Ekran Resmi 20220522 00.30.50.png

We will see...

Posted Using LeoFinance Beta

Sort:  

What I find interesting about it is that it matches seven successive down weeks in the Dow Jones average, also the longest run in many years... I believe since the 1920's?

My point, though, is that BTC seems to follow the legacy financial markets, more and more. Which seems a bit sad, for something that was supposed to be an alternative.

=^..^=

Posted Using LeoFinance Beta

pixresteemer_incognito_angel_mini.png
Bang, I did it again... I just rehived your post!
Week 106 of my contest just started...you can now check the winners of the previous week!
15

Same thing can be said on the way up, successive green candle sticks.

Many thought crypto could be a good portfolio diversifier as traditionally it is less correlated with the legacy markets. More and more so as crypto goes mainstream and adopted by institutions, they go in tandem, legacy markets and policies increasingly impact BTC prices and BTC drives altcoin prices.

Regardless, much more excited during a bear market to accumulate more for cheap.

Posted Using LeoFinance Beta