We now begin the usual review of Glassnode charts.
As we mentioned the day before yesterday, the bitcoin quote has been below the "Realized Price" for over a month.
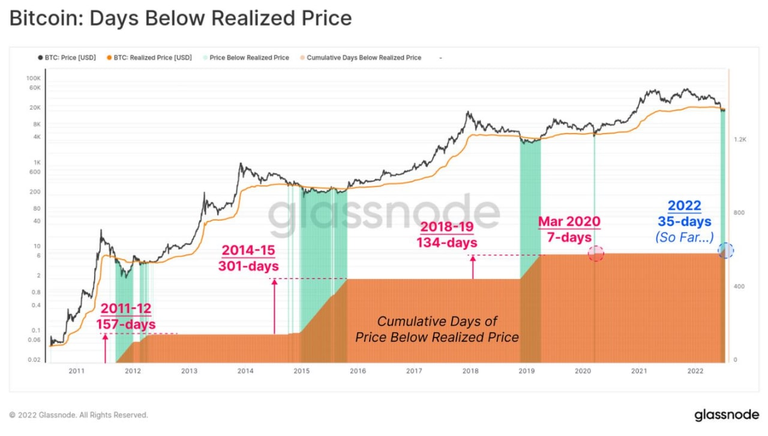
In this chart we see in all previous btc cycles how many days the quote has been below the "Realized Price" before the start of the next bullish cycle.
Leaving out the mini-cycle due to the covid in 2020, the average is about six and a half months.
We are currently 35 days below the Realized Price, so we are still at the beginning of this consolidation at the lows.
The next cycle could then start in the early months of next year.
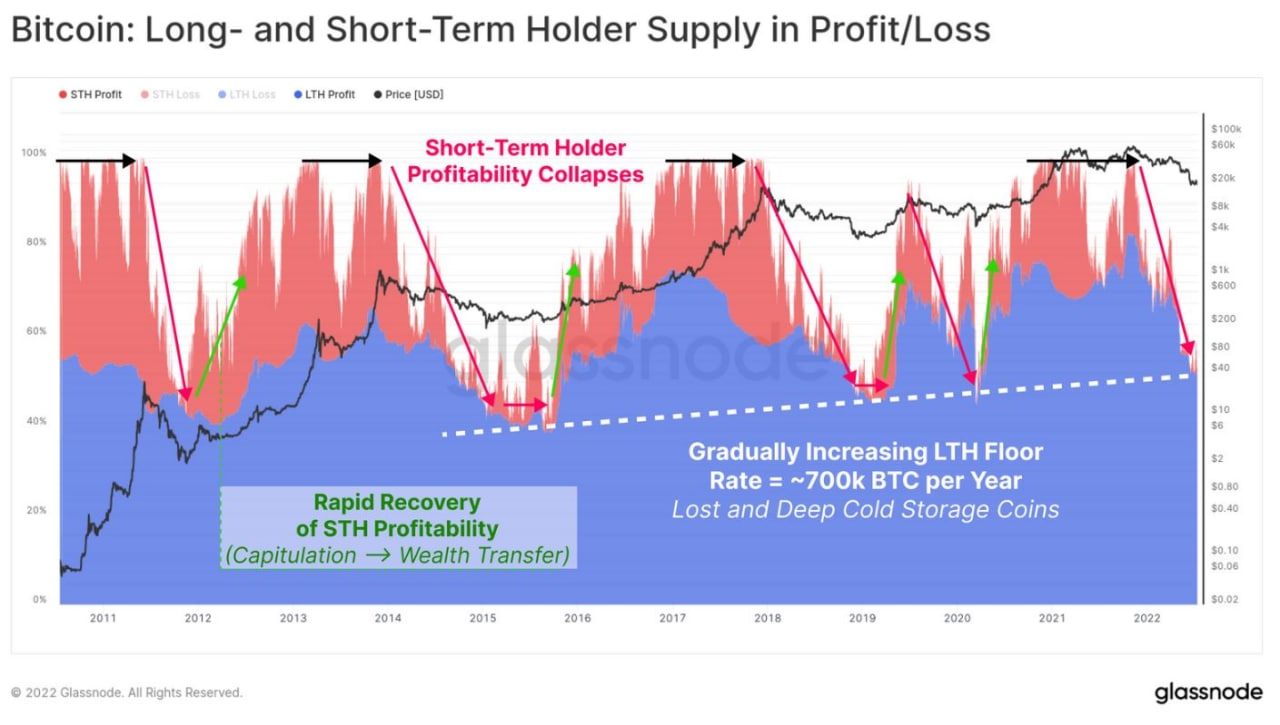
In this chart we can see the exact moment when, in previous btc cycles, the consolidation phase at the lows ended and the next cycle began.
In the period of consolidation at the lows, such as the one we are in now, prices remain below the Realized Price, while the number of traders (Short Term Holders in the chart) who still have coins in profit drops to almost zero (red arrows: the reddish waves disappear from the chart).
The beginning of the next cycle is indicated by the green arrows, which point to the moment when, at the same time, the btc price rises above the consolidation range and the number of traders in profit begins to increase again (reddish waves rising).
In our case therefore we should have:
- btc quotations rising above the range of $17-20,000, and
- an increase in the reddish waves.
This chart can also signal the timing of the start of the next cycle.
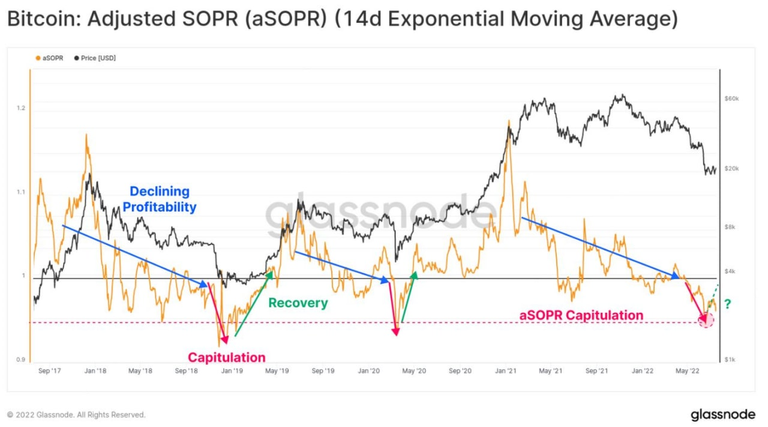
The yellow curve indicates traders' profitability, which has currently fallen below the black line indicating the threshold value of 1 (this is like when the reddish waves in the previous graph disappear).
The beginning of a new cycle occurs when the yellow curve rises above the black line.
In this phase of consolidation at btc lows, these indicators will allow one to distinguish temporary btc price rises that will not be linked to a real start of the next bullish cycle, from rises that will instead indicate a true long-term bullish reversal.
SOURCES
https://insights.glassnode.com/the-week-onchain-week-29-2022/
Posted Using LeoFinance Beta
Posted Using LeoFinance Beta