The MakerDAO protocol is behind the DAI stabelcoin enabling all the mechanics that works around it. The way DAI is minted is through collateral. Users deposit other tokens like ETH, BTC etc. and mint DAI. If the value of the collateral drops below the limit, those users are liquidated.
There are lot of mechanics behind this simple mechanism that enables the stability of the DAI token, like makers, keepers, price oracles, etc, that are making arbitrage all the time, check for market prices or for bad positions for liquidations.
The MAKER token is the governance token that is used for a lot of things when deciding on the protocol positions, like which token can be enabled for collateral, fees and more. It is also the ultimate backstop for DAI, in case of a black swan scenario and needs compensation. This has already happened in the past. The holders of the MAKER token are eligible for fees.
DAI is now the only decentralized stablecoin that still ranks in the top. It’s in the 20th spot and it has slipped down in rankings and fallen behind its centralized competitors Tether and USDC. There are other decentralized stablecoins but their market cap is smaller to compete with the top ones.
More to read on MakerDAO in there whitepaper on the link.
Here we will be looking at:
- Total value locked TVL (collateral)
- DAI supply
- Loan to value ratio LTV
- Top tokens used as collateral
- Defi protocols rank by TVL
- Number of users DAUs
- Price
The period that we will be looking at is 2020 - 2024.
The data here is compiled from different sources like DefiLama and Dune Analytics.
Total Value Locked | Collateral
In the case of MakerDAO the TVL is the collateral deposited to mint DAI. Here is the chart.
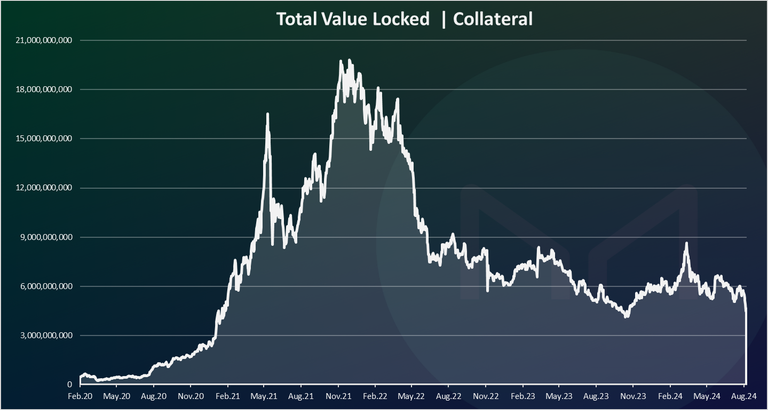
The TVL for MakerDAO was quite small back in 2020. It was under 100M. Then it started growing and in 2021 it has grown exponentially. The ATH for the collateral value in the MakerDAO protocol was reached at the end of 2021 with almost 20B in value.
There was a huge drop in 2022, as the value of the tokens dropped and with the uncertainty in the crypto market. The drop was very noticeable in May 2022 when the TerraUST collapsed and took the whole market down. In a period of few months the collateral in the MakerDAO protocol went from 18B to 8B, losing 10B in value.
In 2023 the collateral value continued to drop even though there was a slight recovery in the crypto market.
At the beginning of 2024 the TVL increased as the price of BTC and ETH surged. At the moment the collateral value is at 6B.
DAI Supply
Here is the chart for DAI minted per day.
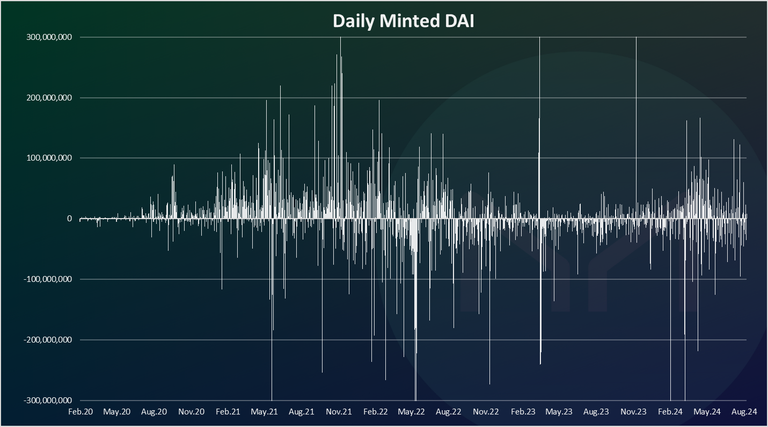
Here as well we can see a slow activity back in 2020 and then an increase in 2021. On occasions there were billions of DAI minted or burned per day in 2021.
We can notice the spikes that happened recently in March 2023, when the USDC coin was depeging, and a lot of capital flew to DAI, minting more than 1B in a few days. After the USDC situation calmed, the next few days there was large amounts of DAI burned. Some spikes on the way down in February 2024 as well.
On a monthly basis the chart looks like this:
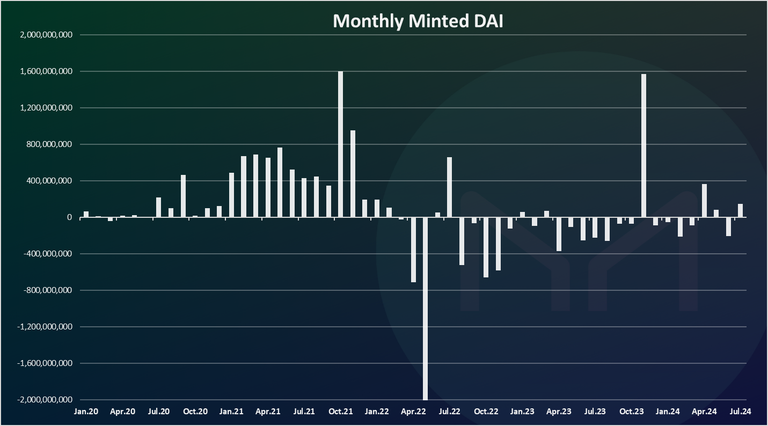
Here we can see the constant positive months back in 2021 with around 700M DAI minted on a monthly basis, and a record of 1.6B in October 2021.
In May 2022 there was a negative 2.2B DAI burnt.
In 2023 we can notice the big spike in November, when 1.5B new DAI was minted. The other months are with a lot less volatility.
The cumulative DAI in circulation chart looks like this:
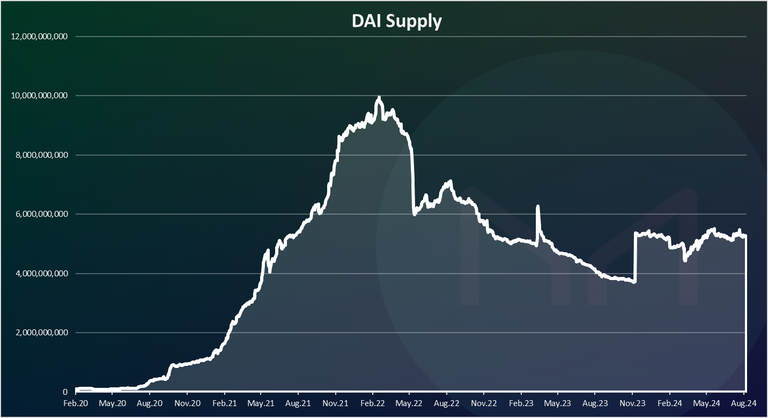
The DAI supply has grown massively in 2021 and the first half of 2022, reaching an ATH of 10B. Then UST happened, the stablecoin marketcap dropped a lot in May 2022, and has continued to go down ever since. A short spike in March 2023, due to the USDC situation. Another spike in November 2023 and almost constant with even a slow decrease in the last months with around 5B DAI in circulation.
It’s interesting to see that with the increase of the crypto prices the amount of DAI in circulation has stayed relatively same. DAI has shown that is resilient and survived bear market, but its grow has been somewhat stale.
Loan to Value Ratio LTV
The LTV value is often used for MakerDAO and DAI, to access the overall health of the ecosystem and the collateral position. It is a ratio between the value of the collateral deposited and the DAI minted. For example, for a 10B in collateral and 5B DAI minted the LTV ratio is 10/5 = 2, or 200% percent. Here is the historical chart.
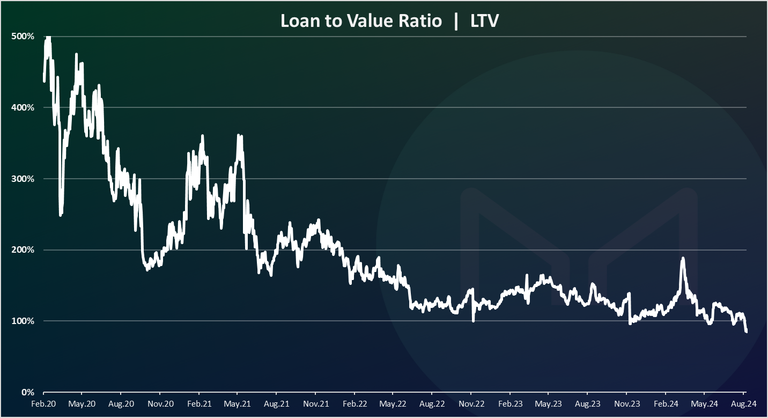
From the chart above we can notice that the LTV value has dropped over time. At the beginning of 2020 this ratio was at 500%, while in the last year it is around 150% or less.
While this ratio might seem low and might show that there are a lot of vaults close to liquidation, we should bear in mind the type of collateral that is being used over time. At first ETH was the number one collateral and was dominant. But as time progressed USDC became a large share of the collateral to mint DAI. Since USDC is pegged to the dollar there is no need for overcollateralization like in the case of ETH and users are minting DAI for 1 to 1 ratio. This lowers the overall LTV ratio.
In the last period the collateral structure for minting DAI has changed and migrated back from USDC to mostly Ethereum. Because of this we can see a recent spike in the LTV ratio.
Top Tokens Used as Collateral
Which tokens are used the most when minting DAI. Here is the chart.
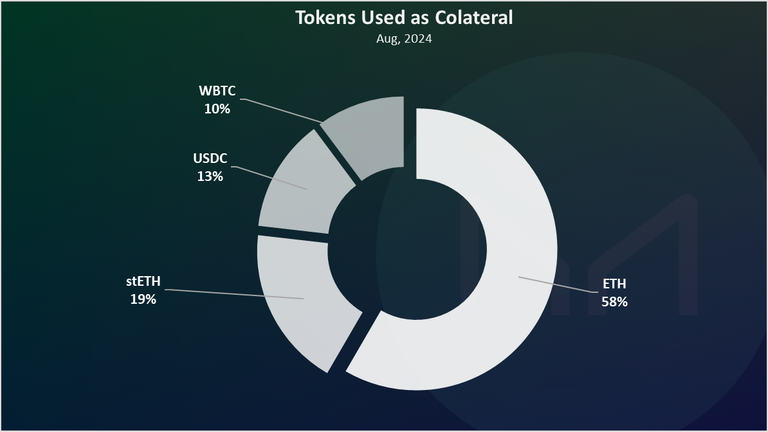
Ethereum is now absolutely dominant with 77% of the DAI collateral, when combined both, ETH and stETH. USDC is on the second spot with 13%, and then BTC with only 10%. At one point the share of USDC was 40%, and we can see now how it has dropped to 13%. These three are the major type of collateral, with few other coins with tiny amounts.
Top Defi Protocols Ranked by TVL
How is the MakerDAO protocol doing when compared to the other ones? The total value locked is usually one of the metrics these protocols use.
Here is the chart.
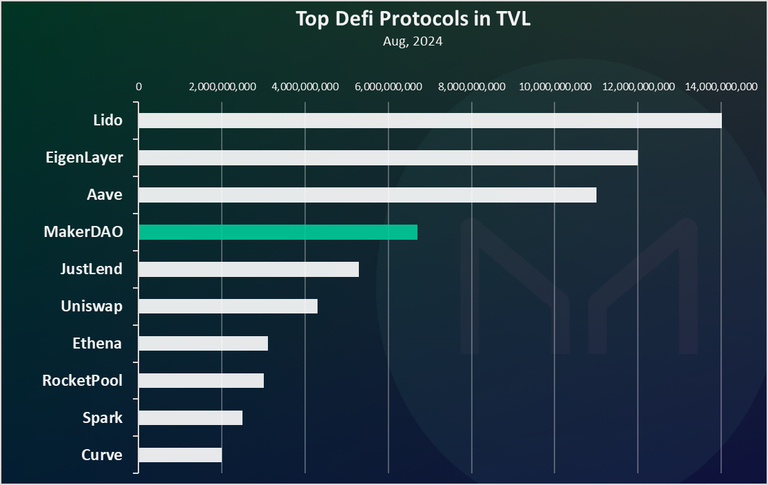
MakerDAO is in the fourth spot. The Lido protocol is leading by a lot on the first spot.
A year ago, MakerDAO was the number one protocol in Defi in terms of TVL, but it has dropped since then.
Active Users
How many users MakerDAO has?
This was a bit of a tricky metric to find as there is a lack of data out there. At the end I settled for the Oasis app number of users, since this is the most used frontend to mint DAI.
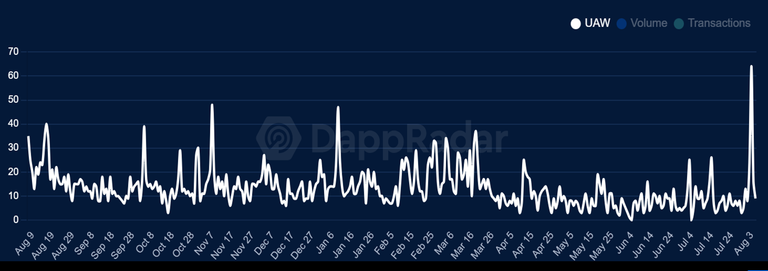
This is a chart from Dappradar that provide data for weekly users.
From the data here we can see that the number of users is quite small ranging from 20 to 100 users on weekly basis in the last period. This is not the whole data, since there are probably other frontends used for MakerDAO, or maybe just API points and smart contracts. However, it goes to show that most of MakerDAO users play with larger amounts and don’t change their positions on a daily basis. It’s a long-term game where you mint stablecoin and repay it very late or maybe never.
Price
When it comes to prices, we will be looking at the chart for the governance token MAKER and the stabelcoin DAI.
Here is the chart for the MAKER token.
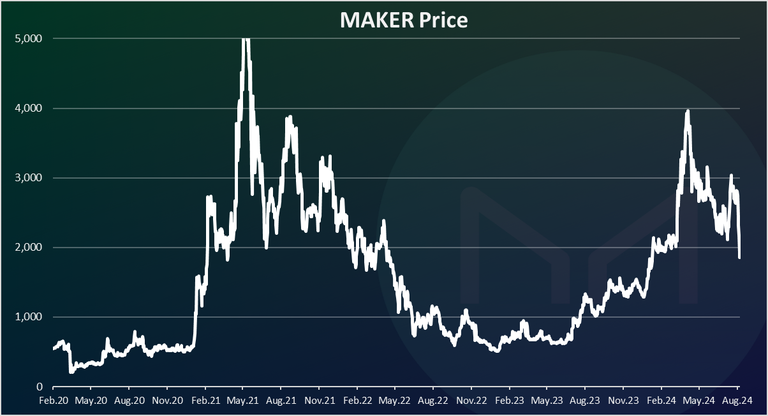
Quite a wild ride for MAKER, going from 400 to more than 5k in 2021, and down to 600 in 2022.
It has recovered a lot since then and was trading around 3k prior to the market crash in the recent days.
All the best
@dalz