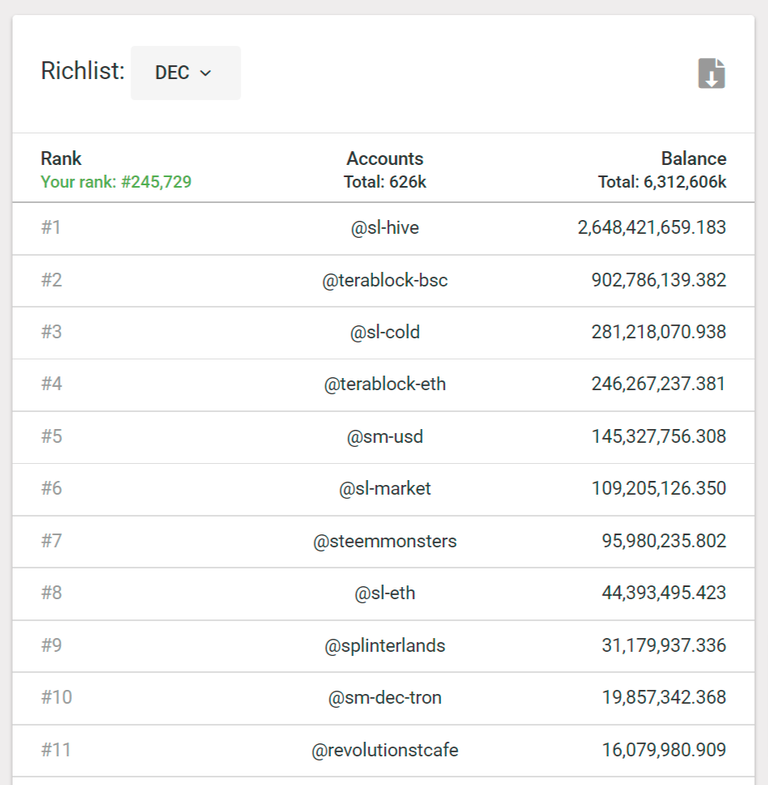
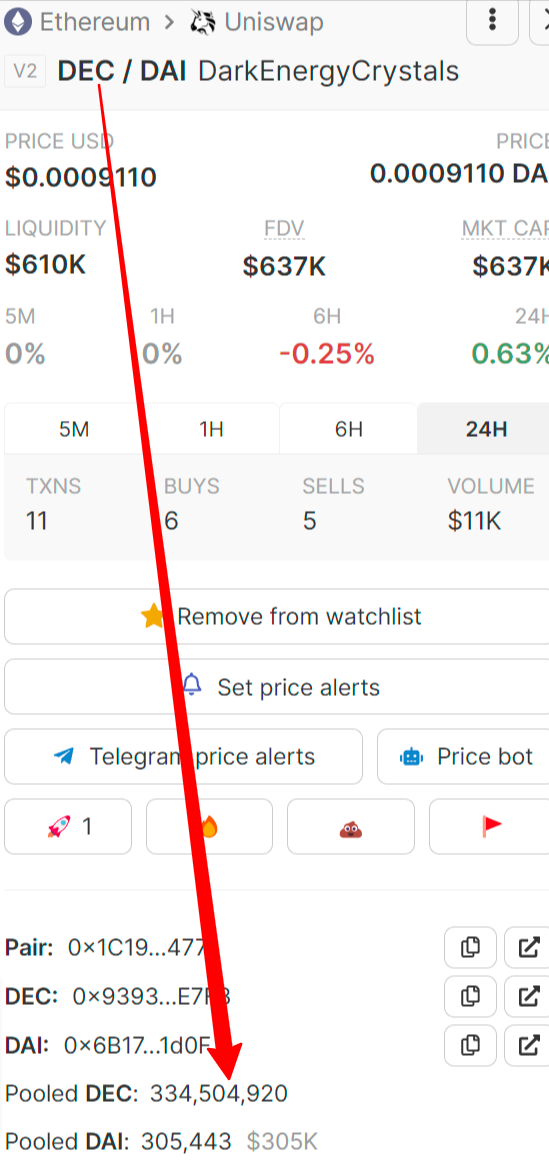
The Splinterlands team has made a few changes pushing for the DEC token to reach its peg of 1000 DEC per $1. Some of it was implemented, while others were opposed when put to vote. Lets take a look at some data.

The DEC token is the reward token for Splinterlands and in theory it is pegged around the dollar with a 1000 to 1 ratio. This is at what price the game accepts the token for card packs.
The thing is in the last year the DEC token has lost its peg, first on the up side, and was trading 10 times above the peg, while recently it dropped below the peg, to 1000 DEC for 0.6$. In the last days DEC shows some strength trading at 0.9.
A few months ago, there was introduced an option to burn/convert SPS for DEC, where the base price for DEC is at dollar. This mechanism provides upper limit for the DEC token. If the DEC price increase to say $2 per 1000, then users can burn SPS for a fixed ratio of dollar worth of SPS to 1000 DEC and then can sell that on the open market and make profit from arbitrage. This in theory should transfer the increase in price from DEC to SPS.
Another change that was made is replacing DEC with SPS as a reward token for battles. This should constrain the supply of the token. There are few more initiative where DEC is being printed to be stopped with printing, like LP rewards and similar, and in the same time there is a transition to price all of the Splinterlands assets in DEC.
We will be looking at:
- Daily and monthly DEC created
- Daily and monthly DEC burned
- DEC created VS burnt
- DEC created from different pools
- DEC supply
We will be looking at the data for 2022.
DEC Created
First for the amount of DEC created. Here is the chart for the daily data.

We can see a steady amount of DEC emission per day up to June and then a sharp increase. There was a few spikes with more than 20M DEC issued daily in the period of June to August 2022. This was mostly because of the low DEC prices.
Then a sharp drop at the end of August and a tiny amount of DEC created in September and October.
The get a better representation here is the monthly chart.

We can notice the trend here as well, with June being the months with the most DEC created, and almost zero DEC created in the last two months, September and October 2022.
DEC Burned
DEC is burned for in game assets purchases and it is something that need to be taken into consideration. Here is the daily data.

A clear uptrend in the last months, starting from August 2022.
Here is the monthly chart.

We can see that from July there is more DEC burned, with a ATH in September where there was almost 200M DEC burned. Not totally sure but there might be some large team tokens consolidating in this month.
DEC Created VS Burned
When we put the numbers for created and burnt, we got this.

Clearly a change in the trend in the last period, again starting from August 2022. Since then DEC is basically deflationary with more DEC being burnt then created.
DEC Supply
Here is the chart for the DEC supply.

This chart probably shows the DEC supply in the best way.
The year started with 1.8B in supply and kept increasing until August when it reached more than 3B supply. Since then a drop in the supply and we are now at the 2.8B in DEC supply. In the last months there has been reduction in the DEC supply for around 300M tokens or around 10% of the supply.
Market Cap
While the DEC price has been on a roller coaster, especially in 2021, the market cap might paint a better picture for DEC, especially having in mind the rapidly changing DEC supply.
Here is the chart.

The year started with 9M for the DEC market cap. A sharp drop in the first half of the year reaching 2M in market cap in June. Since then the DEC market cap has been quite stable around the 2M USD, with an uptrend in the last week to 2.5M. This is still a low market cap for a token. For example the other stablecoin in the ecosystem HBD is around 10M, and those are tiny numbers when compared for the top stablecoins.
All the best
@dalz
Posted Using LeoFinance Beta


