The growth of Solana has been nothing but explosive in 2021! The chain seems like it came from nowhere and grow with amazing speed reaching the top 10 coins.
Let’s take a look at some data.

Solana has some unique tech. It is a sort of hybrid between Proof Of Stake (PoS) and a novel concept that they call Proof Of History. There is a lot to say about the proof of history concept, but in short here we will just mention that it is a concept that checks are all the transactions in the right order/sequence. The Solana blockchain works with slots of periods of time, in which the chosen validators confirm the transactions.
Solana has a reputation for one of the fastest blockchains in the history, with a theoretical possible 65000 transactions per second. Solana also has a controversial reputation over its decentralization, since it has been put under maintenance and stopped operating a few times in the past. Blockchains usually don’t have under maintenance mode.
We will be looking at:
- Active Addresses
- Daily Transactions
- Fees
- Staking and Voting Rewards
- Inflation and Supply
The period that we are looking into is August 2021 to March 2022.
The data for the analysis are taken from Dune Analytics, where I have forked existing queries for Solana and adjusted the time frame.
Active Addresses
One of the key metrics for a blockchain is the number of active wallets. Here is the chart.

There has been a growth in the number of active wallets on Solana starting from August last year up to February 2022. After this, a small drop in the numbers and now the numbers are between 200k to 250k. Compared to BTC and ETH there is more then 500k active accounts there now.
Note: according to one of the Solana explorers solscan.io the number of active wallets is somewhere around 600k, so there is some differences in the data. Not sure why us this.
Daily Transactions
The activity on the networks is mostly represented by the number of daily transactions. Here is the chart.

The number of transactions is where Solana shines. It probably holds the record for a number of daily active transactions. At the peak there was more then 70M transactions per day. In the last period there is between 30M to 40M transactions per day. Compared to ETH where there is just above 1M, or even Polygon where there is 5M to 10M transactions per day, Solana is leading by a lot.
Fees
Fees are quite the unpopular topic and one of the main reasons for the new EVM chains, as users are trying to find a way to escape ETH high fees.

The fees here are in SOL.
A gradual uptrend in the amount of SOL paid for fees daily in the overall period. At first the cumulative daily fees were around 300 SOL and in the last period they are around 600 SOL. If we take the price of SOL around 100$, this is around 30k to 60k USD per day.
Staking And Voting Rewards
Fees are just one aspect that the Solana validator receive as rewards. Thee are also staking rewards and voting rewards.
Here are the charts.

The staking rewards have been quite constant in the period with around 130k SOL. Note that these are three days timeframes so, the daily SOL for staking rewards should be around 40k.
The voting rewards looks like this.

We can see that there has been an increase in the voting rewards in March 2021 and since then they are quite constant with around 75k on a three-day basis (25k per day).
Inflation and Supply
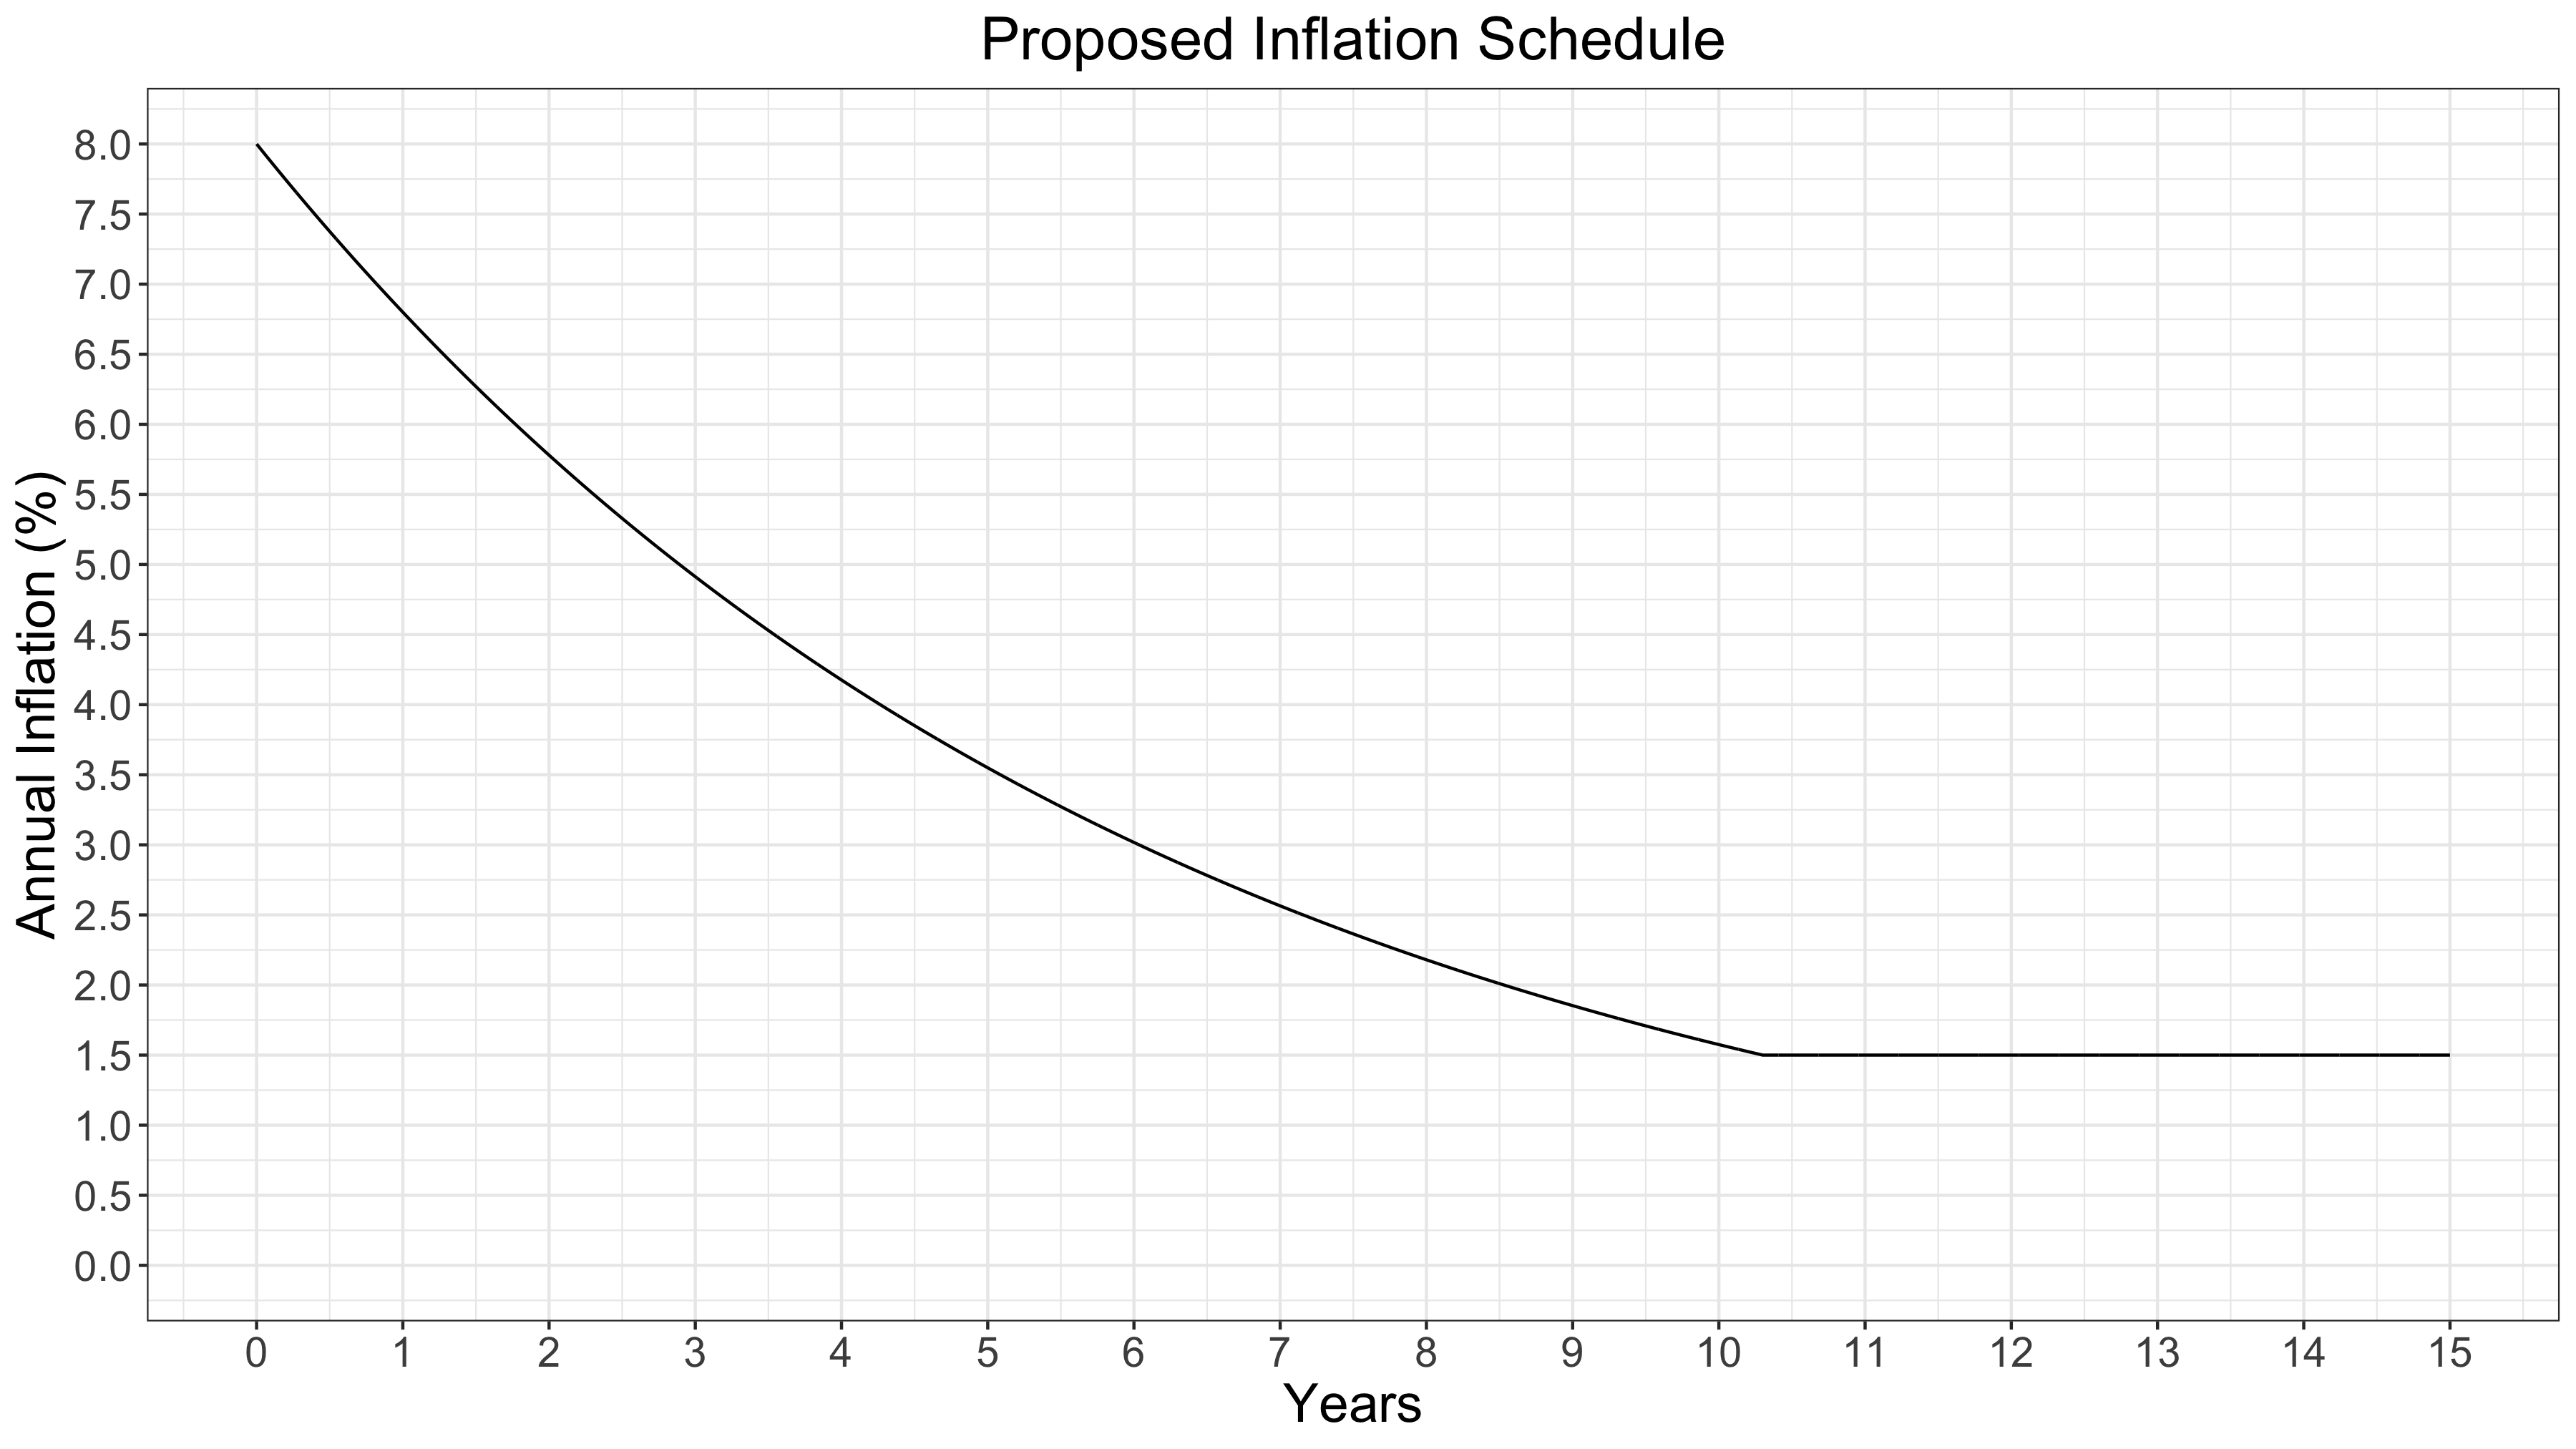
The inflation and supply are on of the most important metrics for a blockchain. Here are the charts from the official Solana docs.

The inflation rate for Solana starts with 8% per year and drops each year, reaching 1.5% after 10 years and stays at that level for the future years.
The supply looks like this.

The current supply of Solana is around 325M, but as we can see from the chart it is projected to reach more then 700M in 10 years time, basically doubling the supply. After that the inflation should slow down at 1.5% per year, and the supply should increase slowly.
Solana obviously has earned its nickname the fastest blockchain with 40M to 80M transactions per day. But when we look at the number of daily active accounts, we can see that the numbers are still lower then the top blockchains. Meaning smaller number of accounts are making a lot of transactions. The trends for most of the charts has been up for the 2021, with a recent decrease for the start of the 2022. This is in parallel with the overall crypto trends.
All the best
@dalz
Posted Using LeoFinance Beta


