It's the last day of the week today, at least for me as I start the week on Monday, so it's time to have a look at what $HIVE has been doing lately. Next week is an important one and will be like a crazy roller coaster ride, so it's good to be prepared for what's coming.
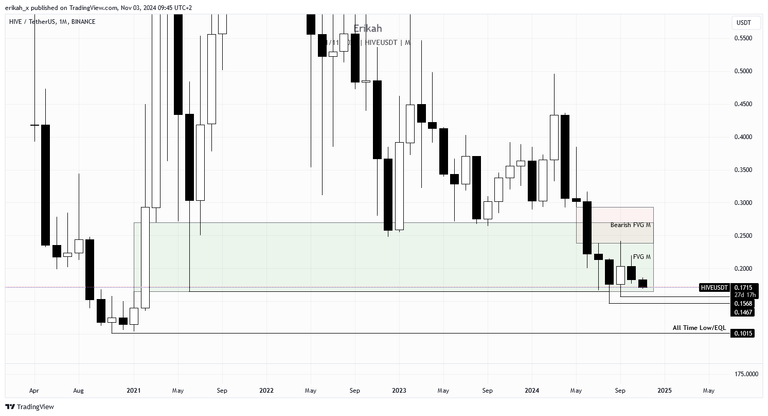
Thursday was the last day of October, so we got the monthly close and unfortunately we got a bearish candle. It's not an bearish engulfing candle, but the candle printed by the two and a half days passed since then is also bearish and right now we're at the bottom of the bullish FVG, marked with green on the chart. Candle close is far away as there are 27 days till that happens, but right now chances are price is heading towards the most obvious and closest liquidity pool, which is at $0.1568. The ideal scenario would be a quick wick down to sweep liquidity below $0.1468 then continue up, but we'll see if the upcoming political events will have the power to do that.
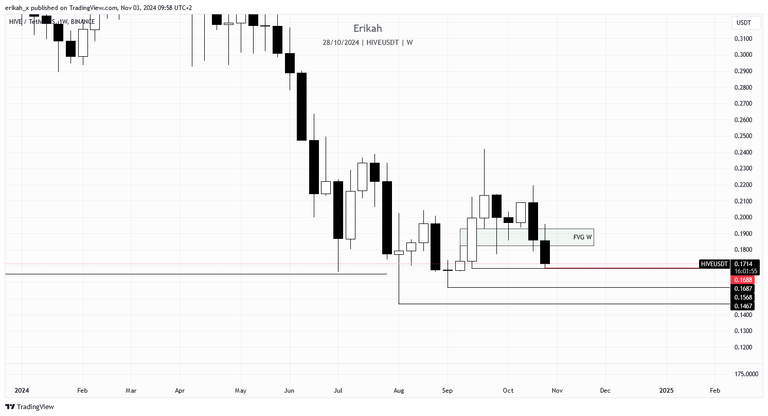
The weekly chart mostly says the same thing. Should the weekly candle close as it is at the moment, meaning below the bullish FVG (green on the chart), that means the FVG will be inverted to a bearish one and will act as resistance. The funny thing here is that price failed to sweep liquidity below $0.1687, missed it by $0.0001. As things stand right now, chances to sweep that liquidity pool are quite high now, but we'll see. It may not happen today as there's no catalyst to drive price that low on Sunday, but there will be plenty of chance for that to happen next week.
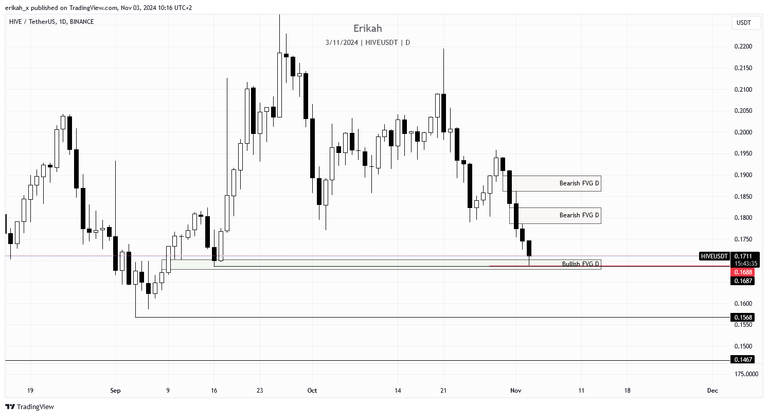
The daily chart shows clearly that price is heading towards a support area. We have two intermediate lows, at $0.1688 and $0.1687, which will be swept soon. The question is, will the bullish FVG be able to support price and can we get a bounce here? Or we're going lower to sweep liquidity below this level?
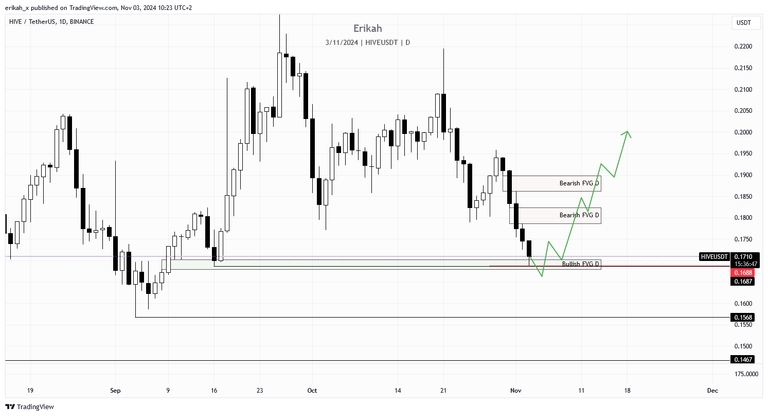
If we do and price bounces at this level, I can see the above scenario happen. Again, price action depends heavily on the outcome of the next week's election and you need to factor in high level of manipulation as well. Everyone with half a brain knows the to candidates have different political and economical views, one is promising to crypto (if word is kept), the other is not, so we'll see. Market makers are prepared to shake out everyone and hit as much stops as possible, so it's our duty to protect our capital. But no worries, you can only trade $HIVE on one exchange with leverage, we're still in stone age with this (it seems this is not a priority of us), so ...
On a more granular scale, the h4 chart shows $HIVE is in a down trend since Tuesday, and the price leg down is not a balanced one. We have four bearish gaps, none of them rebalanced, so the move up will not be fast, unless we get a political catalyst. But then again, a fast move up will result in gaps, which could mean a potential reversal to rebalance this gaps later.
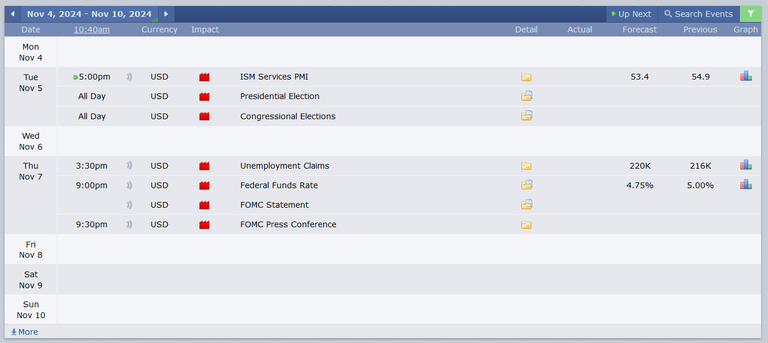
Looking at the economical calendar, we have 2 red folder days, but I'm prepared to see a roller coaster ride every day, regardless who wins the elections. I'm curious to see the data on Thursday, as unemployment claims and Federal funds rate are both important and key to the economy.

Let's have a look at what $BTC s doing, shall we?
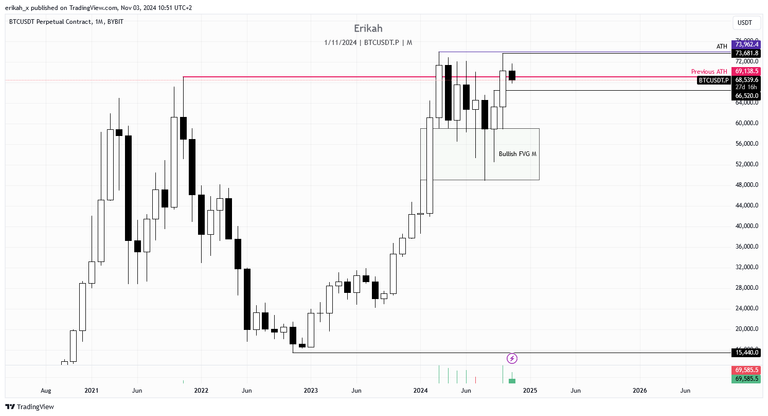
The monthly chart doesn't look bad at all. The last bullish FVG has been rebalanced and is holding price nicely so far. Last month closed with a nice bullish candle and even though price failed to sweep liquidity above the recent ATH, still closed above the old ATH.
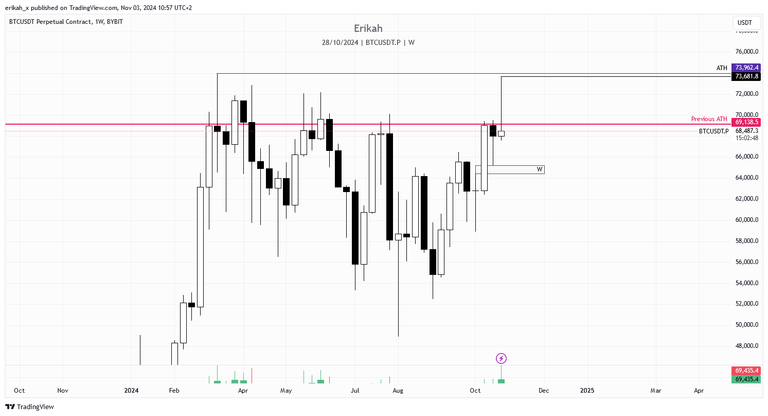
The weekly chart is more specific and not something you ideally want to see if you're in the bulls' team. We had a very nice move to the upside this week, price swept liquidity up until $73681, but got rejected before it could establish a new ATH and should price close as it is now, we have a huge upside wick. The bullish FVG has not been retested yet, so I'm keeping an eye out of this possibility as well.
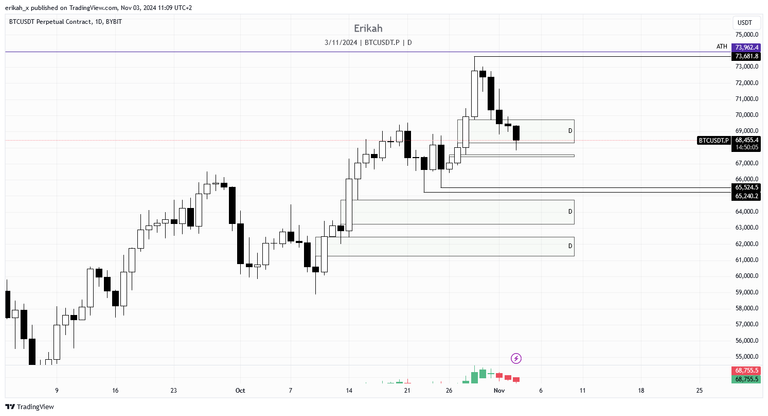
The daily chart looks a bit tricky right now. Price has rebalanced the bullish FVG, it is still inside the gap, but very close to the bottom. Daily close will be interesting and important too. Should price close below the gap, that means bearish expectation and in that case, chances are for price to seek liquidity at the slim gap below, or even lower, at $65200 - $65500 level, or even lower.
Again, we're heading towards elections and this week it's going to be a historical one, which is going to be visible on the charts to. $BTC is highly affected no matter which candidate will win and I'm prepared for both scenarios.
If you're new to trading, better sit on your hands next week, stay away from leverage and protect your capital as things are going to go wild for sure. We've seen what red folder news days can do to crypto, imagine what an election can create, an event of which outcome is crucial for the whole world.
Stay safe everyone!
As always, this is a game of probabilities, not certainties. Also please note, this is not financial advice, it's my view and understanding of the market.
All charts posted here are screenshots from Tradinview.

If you're a newbie, you may want to check out these guides:
- Communities Explained - Newbie Guide
- Cross Posting And Reposting Explained, Using PeakD
- Hive Is Not For Me
- How To Pump Your Reputation Fast - Newbie Guide
- Tips And Tricks & Useful Hive Tools For Newbies
- More Useful Tools On Hive - Newbie Guide
- Community List And Why It Is Important To Post In The Right Community
- Witnesses And Proposals Explained - Newbie Guide
- To Stake, Or Not To Stake - Newbie Guide
- Tags And Tagging - Newbie Guide
- Newbie Expectations And Reality
- About Dust Vote And Hive Reward Pool, by libertycrypto27


