It's Sunday again and time for another analyses as this week was not only important for our industry, but crucial as well. The US had the elections and people spoke up about what they want. The outcome is good for a part and bad for the other part, as it is with every election. Me as an outsider, I can only judge the outcome from my point of view and as I'm an interested party when it comes to cryptocurrency and freedom in this regard, I'm happy with the outcome.
The market had the expected reaction and I believe this major event acted as a catalyst and moved alts out of a consolidation phase and helped $BTC to establish a new ATH every day and this is jut the beginning. So let's see what our beloved layer 1 token did this week.
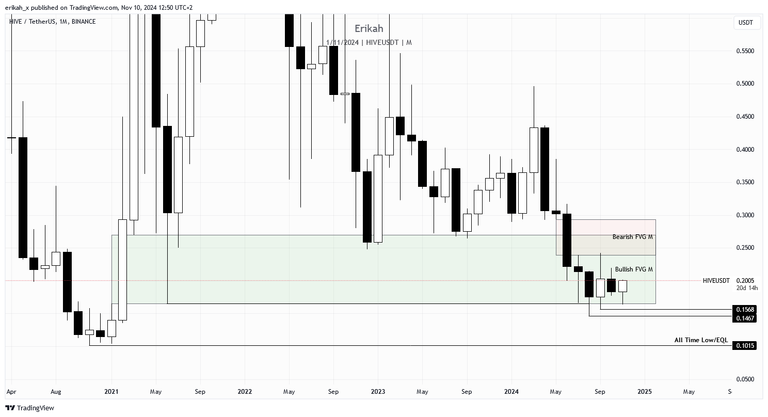
Although it's only the 10th today, the monthly chart looks quite different from what I posted last time. So far we have a bullish candle and at the moment of writing, $HIVE is trading at $0.2005. I'm not going to repeat what I've been written about the two fair value gaps you see on the chart, you can check m previous report for that, but there's something interesting I'm going to show you below.
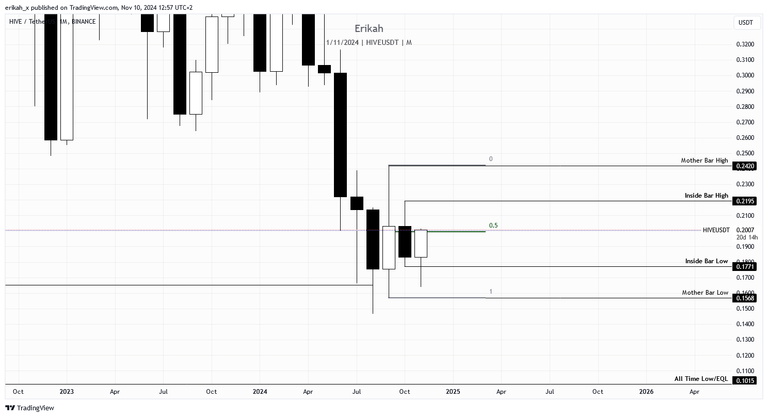
There's an inside bar pattern on the monthly and although I'm not a pattern trader, this is the only pattern I'm paying attention. I like how this looks like, because the current candle has a long downside wick, which shows buying pressure. After sweeping liquidity on the downside, at the time of writing, price is slightly above the midline, seeking liquidity above, at $0.2195, which is the inside bar high. As I said, it's too early to predict anything as only 33% of the month passed, but things are not looking bad here.
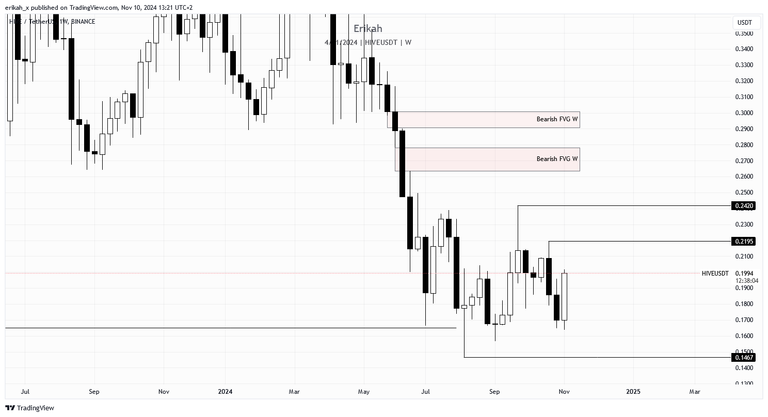
The weekly chart looks good, there's still around 10h left of till the candle close, but so far we have a bullish engulfing candle, which usually means continuation to the upside. Next I'm looking at $0.2195 and $0.242 for now.
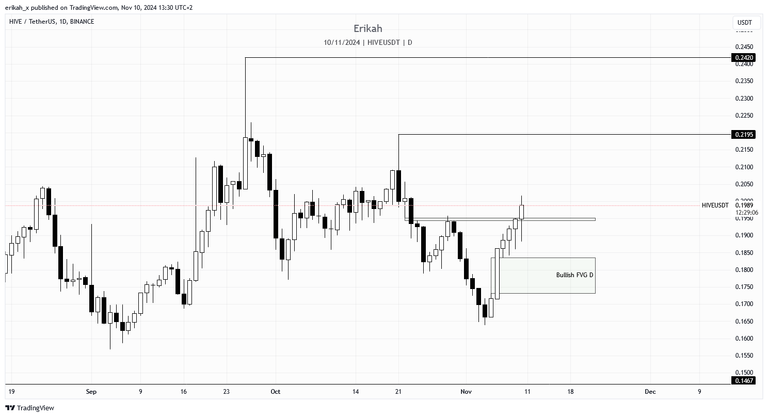
The daily chart also looks good, price is printing the 6th consecutive bullish candle as should price close as it is now, that would means inverting the slim FVG and turning it into support. Looking at what's above, there's not much to stop price, so the next targets are the ones mentioned above. It's true that we have a huge bullish FVG below, created on the 6th, when the results were announced, which I hope it won't be retested. But again, this is a game of probabilities, so who knows. The momentum is still there and I hope the consolidation that has to happen at some point won't get there.
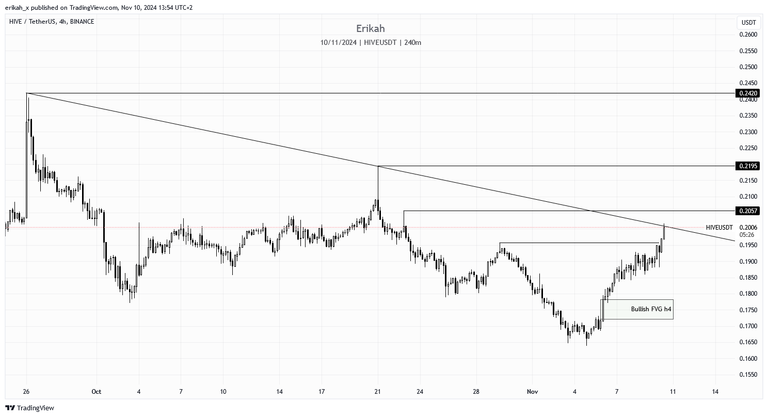
On a more granular scale, the h4 chart also looks good. I'm not a trend based trader, but this is so obvious, would have been a shame not to draw up that trendline.
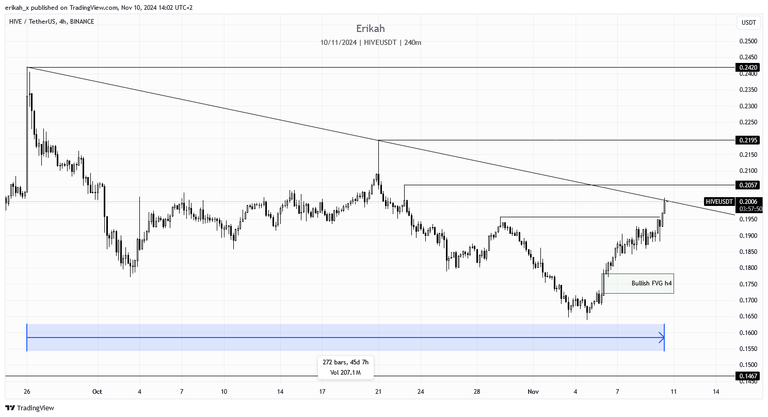
So price swept liquidity at $0.2055 level, braking out of a 45 day downtrend. So far price is printing a higher high on the h4 and looking to sweep liquidity above the marked and mentioned levels. The sell side is pretty balanced, there's not much to stop price, but again, this i a game of probabilities and $BTC also has a say in how alts behave.
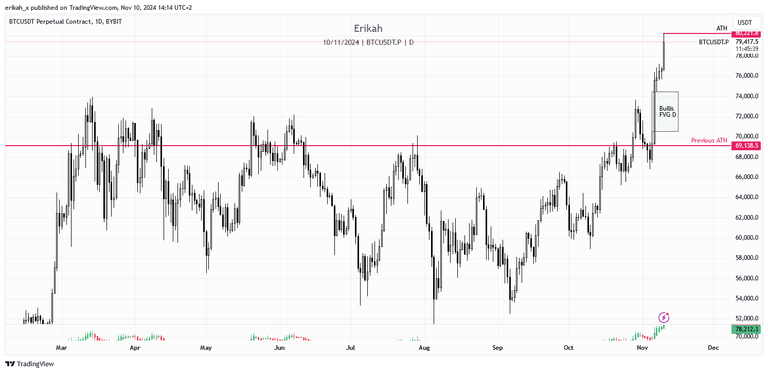
$BTC daily chart shows a different picture. After being rejected countless times, this week price was able to turn the old ATH into support and at the time of writing, $BTC is trading at $79570 and the new ATH is at $80221.
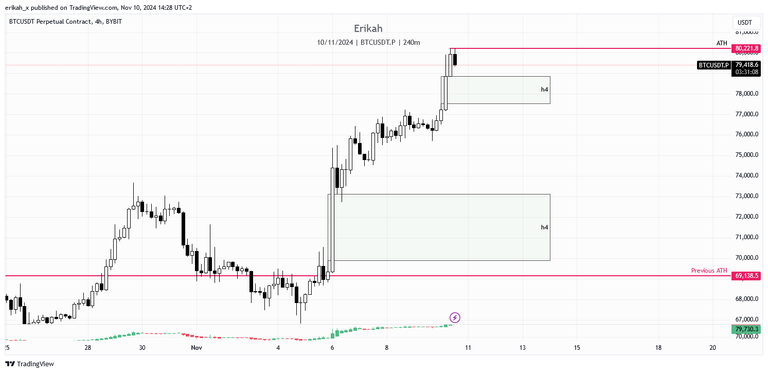
The h4 chart shows where the liquidity pools are, which is the ATH and the 2 FVGs.
It's a bit difficult to do TA on an asset that is in price discovery. I mean obviously we have the Fib based extension, or I could extrapolate based on the previous data, but prefer not to at this point. All I want to say here is, that nothing goes up in a strait line. We had a lot of bullish news this week. First the results of the election, then the promises the president-elect made, which acted as catalyst and we got the new high. However, market makers are happy to use and abuse those who have no experience in trading and surprises can happen.
So far things look good, we get what we wanted. Hive did not blow off the roof yet, as other alts, but I see our token as a sleeping giant and hope it's going to have a nice run this time too.
Stay safe, be smart and preserve your capital.
As always, this is a game of probabilities, not certainties. Also please note, this is not financial advice, it's my view and understanding of the market.
All charts posted here are screenshots from Tradinview.

If you're a newbie, you may want to check out these guides:
- Communities Explained - Newbie Guide
- Cross Posting And Reposting Explained, Using PeakD
- Hive Is Not For Me
- How To Pump Your Reputation Fast - Newbie Guide
- Tips And Tricks & Useful Hive Tools For Newbies
- More Useful Tools On Hive - Newbie Guide
- Community List And Why It Is Important To Post In The Right Community
- Witnesses And Proposals Explained - Newbie Guide
- To Stake, Or Not To Stake - Newbie Guide
- Tags And Tagging - Newbie Guide
- Newbie Expectations And Reality
- About Dust Vote And Hive Reward Pool, by libertycrypto27


