After one week, I'm back to share a new $HIVE report with whoever is interested. I was hoping to give you different news, but I can only tell you what the chart says.
Today it's the 15th of the month and September being a 30 day month, today marks exactly half of the month.
For a better visual experience, I tried to use some colors on the chart, for those of you who are not familiar with candle charts and technical analyses in general. This is not standard in charting, but I hope it helps you understand better what I'm talking about.
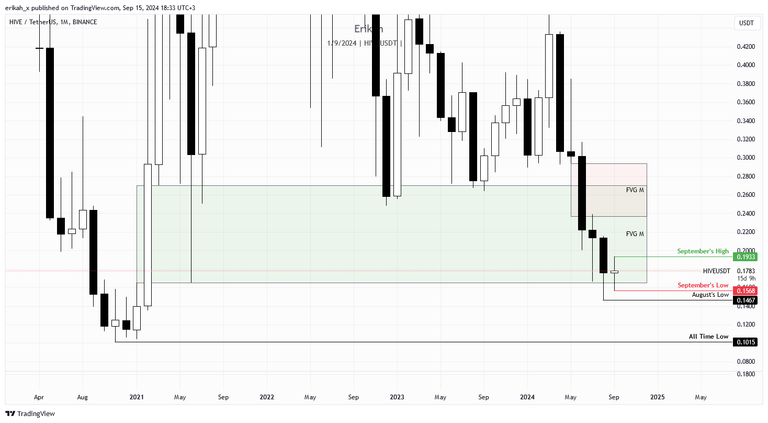
As you can see, on the monthly chart so far price printed a doji candle, which means indecision. Right now $hive is trading almost at the level where last month's candle closed. The highest of the month was $0.1933 (marked with green) and the lowest was $0.1568 (marked with red). There are still two weeks till the candle close and I truly hope we can see a white candle in September. If not, we're going to register the sixth bearish candle, or a doji. They say after 7 consecutive candles of the same color the trend usually reverses, but I don't think that's a rule, it's more like a saying which can be true or not. I don't take these saying seriously, facts are what we should base our analyses on.
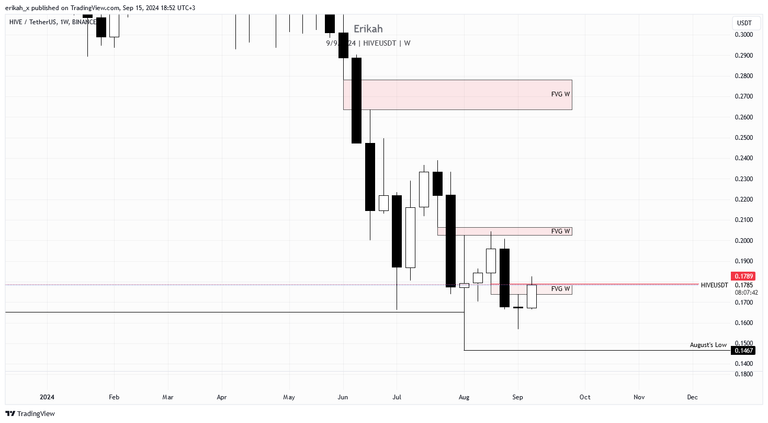
On the weekly chart, things look a bit different, more encouraging I dare to say. Last week price printed a doji, which, again, means indecision, but this week we have a nice bullish candle, engulfing candle, which means bullish continuation and if the candle manages to close above the bearish Fair Value Gap (the rectangle marked with red), and hold the $0.1789 level (marked with red), that could indicate continuation to the upside. There are still 8 hours till the candle close, anything can happen, so we'll see.
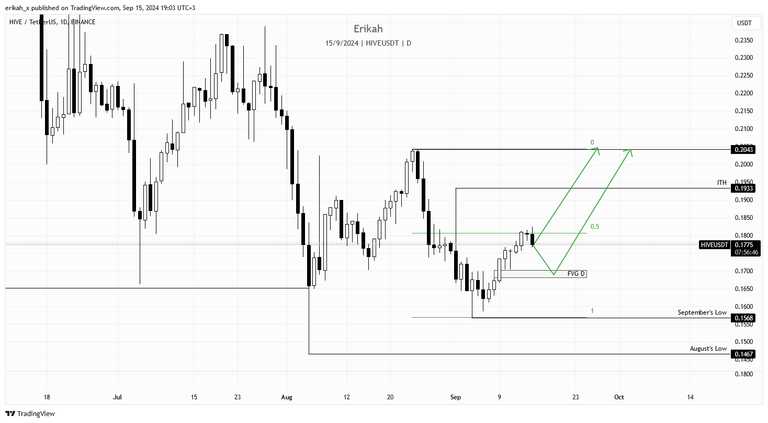
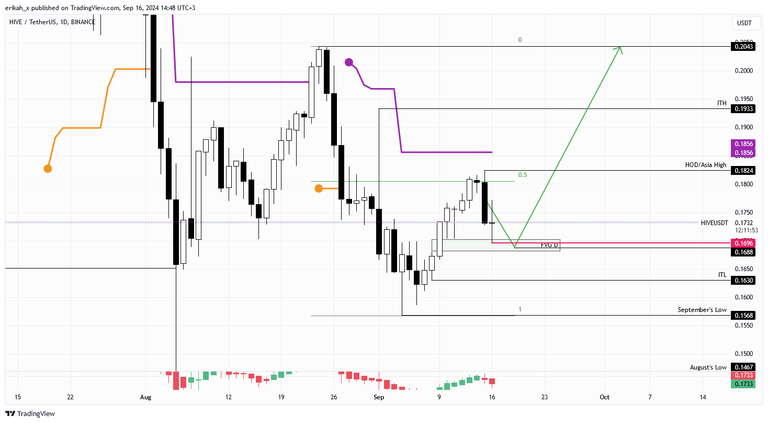
The daily chart looks even better. I think it's safe to say we had a bullish week, regardless of the bearish candle we have today. After seven bullish candle a little pullback or consolidation (whatever this is) is healthy. I don't like to make predictions, as there's always three scenarios to watch and the joke is,you draw up all three and whatever happens you're right, but based on the chart, I'm expecting price to retest the green box, the bullish FVG, or if $BTC wants to go higher, then the next level I'm looking for price to reach is $0.2043. Time will tell.
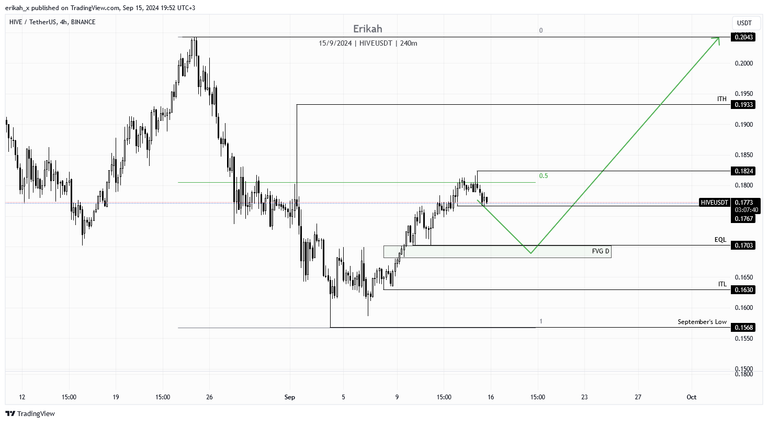
Looking at price on a more granular scale, the 4h chart is a bit of a puzzle for me. Looking left, all the highs were swept till now and the next liquidity pool is at the top of the wick at $0.1933. There was a huge wick on the 1st of September, most likely due to a bigger order, which swept liquidity till that level.
I left the daily FVG on the chart, which can act as draw of liquidity, not to mention we have equal lows at that same level, which acts the same way. So the path I draw on the daily chart looks more plausible, but then again, this is a game of probability, not certainty. We'll see what happens.
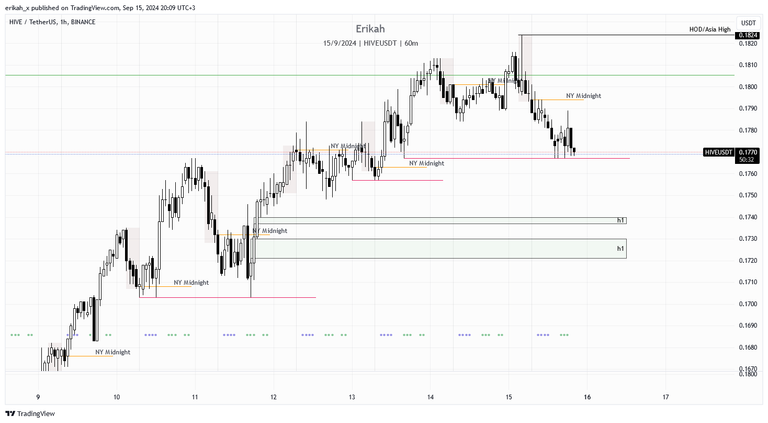
The hourly chart looks really interesting. If you have a very close look, those red lines on the charts are marking equal lows and as I said above, it can act like magnets.
We also have two bullish FVGs on the chart, which should defend price. To be honest, I would short this if there would be a trigger, but as we know, shorting is not possible, because ... because after 3 years or was it 4 (?), we still have no perp contracts.
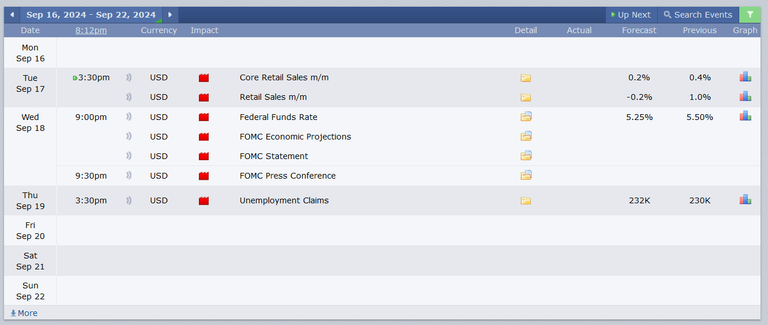
In terms of news, next week is not going to be bring. Maybe Monday will be quiet but Tuesday, Wednesday and Thursday you can expect a roller coaster ride as we have Core Retail Sales, Retail Sales, Federal Funds Rate (this will make some waves for sure), FOMC and Unemployment Claims. This in plain English means four days of crazy volatility and manipulation and even though $HIVE is not a very liquid asset, it is always affected to some extent.
So the long waited pump everyone is dreaming about is not as close as some may think or hope. $HIVE is still very close to the All Time Low, but I hope we won't sweep that low.
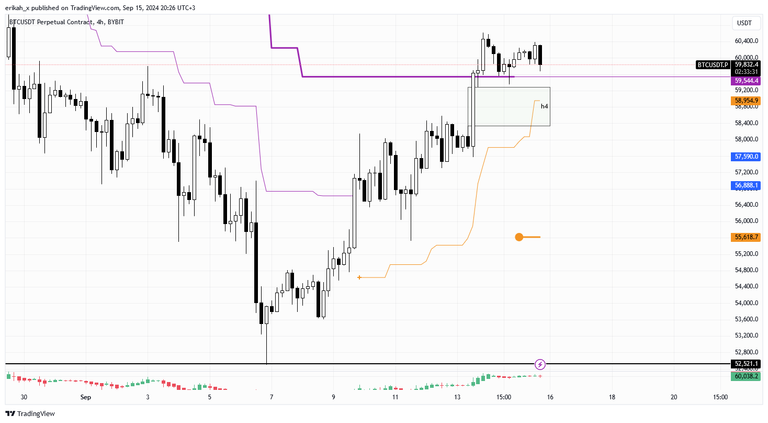
$BTC flipped a high time frame level to support on Friday and so far price managed to stay above it. I'm talking about the $59.5k level, marked with purple on the chart. As long as $BTC manages to hold this level (stay above it), $HIVE is kind of save too. Once $BTC starts to lose strength, it'll drag the whole market down and alts will bleed for sure.
As always, this is a game of probabilities, not certainties. Also please note, this is not financial advice, it's my view and understanding of the market.
All charts posted here are screenshots from Tradinview.
Later Edit
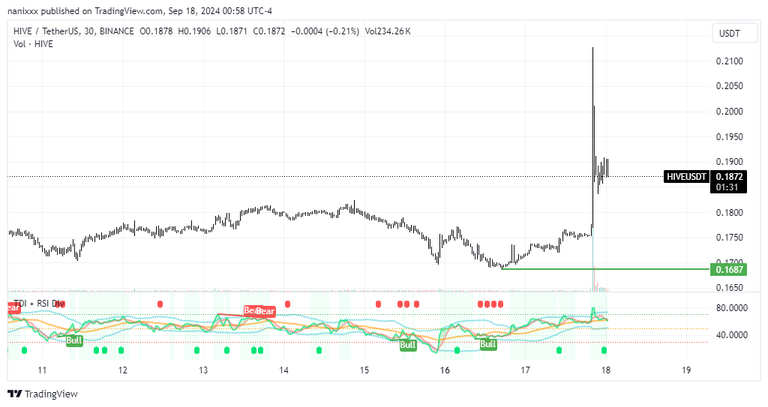
Time of edit is 2:49 (UTC+3) 16.09.2024 and this is what price did.
Price missed my target by $0.01 or so, not that this was a prediction. But it's fun.

If you're a newbie, you may want to check out these guides:
- Communities Explained - Newbie Guide
- Cross Posting And Reposting Explained, Using PeakD
- Hive Is Not For Me
- How To Pump Your Reputation Fast - Newbie Guide
- Tips And Tricks & Useful Hive Tools For Newbies
- More Useful Tools On Hive - Newbie Guide
- Community List And Why It Is Important To Post In The Right Community
- Witnesses And Proposals Explained - Newbie Guide
- To Stake, Or Not To Stake - Newbie Guide
- Tags And Tagging - Newbie Guide
- Newbie Expectations And Reality
- About Dust Vote And Hive Reward Pool, by libertycrypto27