Another week passed and here I am, with another technical analyses post on both $HIVE & $BTC, as usual. It was a crazy week, especially when it comes to Bitcoin, we got a new ATH every day, or every hour? Anyway, these are fun times to be alive, but let's see what out beloved layer 1 token has been doing lately.
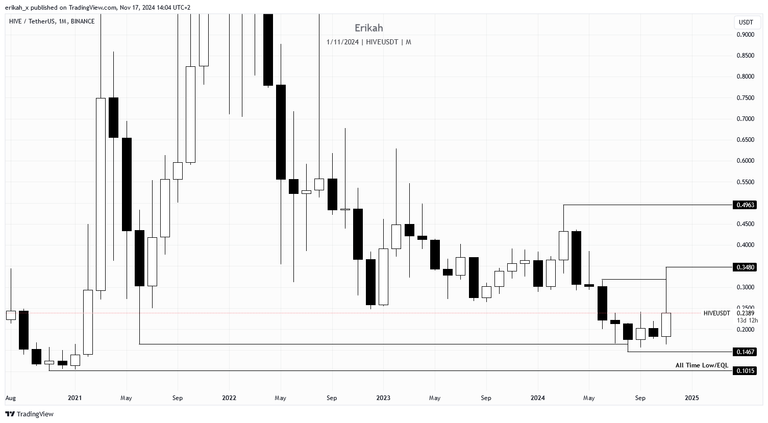
The monthly chart looks better than last time, even though there are two weeks till this candle will close. So far we have a bullish engulfing candle, which usually means continuation. The problem is, we have a huge upside wick, which was created this week and indicated a bigger buying order, which swept liquidity on the upside, until the $0.348 level. At the time of writing, the wick is bigger than the body of the candle, with is not something I like, but there are two weeks still, till the candle close.
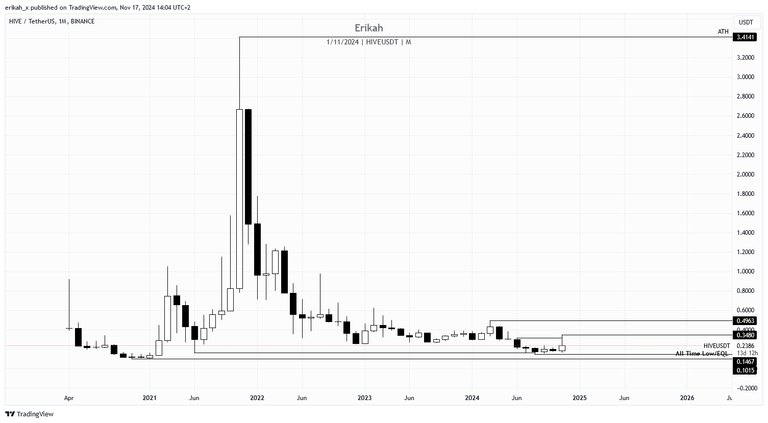
The good news about the monthly chart is, there are no gaps on the sell side, to stop price, this side of the curve is pretty balanced.
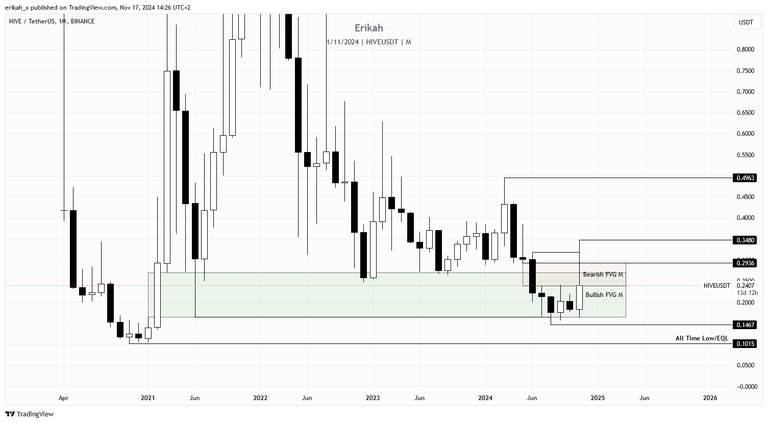
For bullish continuation, price has to close above the bearish FVG (above $0.2936) that is capping the market right now.
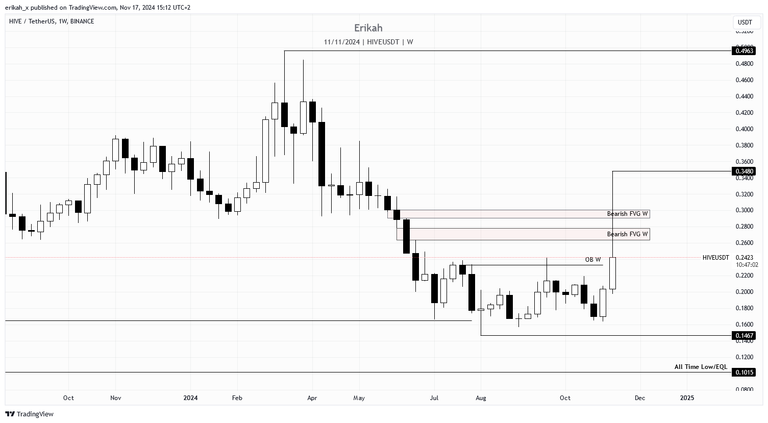
The weekly chart looks awful. That huge upside wick is that is bothering me. Price has rebalanced the two bearish FVGs, but could not invert either of them and most likely will close below both, in 9 hours. The good news is, should price close the candle as it is, that would mean a change in delivery as it would close about the weekly OB and that means price will be delivering from a bullish OB. But for that, we first need to wait for the candle close.
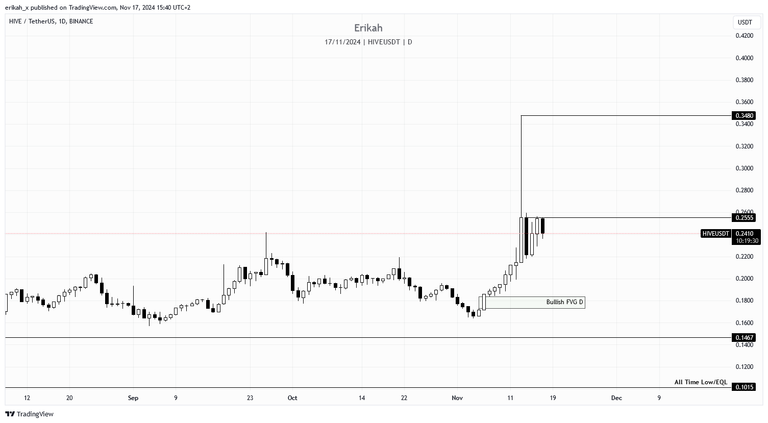
The daily chart does not look good to me, at all. I'm really sorry to say that, but this setup is not something I would gladly trade, unless short it, if I get a trigger. Right now the downside looks better than the upside. Lots of untapped liquidity, unlike the upside, where we only have that huge wick. Yesterday's candle failed to close above the OB, today's candle is not closed yet, but chances are it's going to be a bearish one, which means price is going to seek liquidity lower. There's the bullish FVG at the $0.18 region, which means liquidity pool, so let's see if we get there. In case of reversal, the upside target remains the $0.348 level.
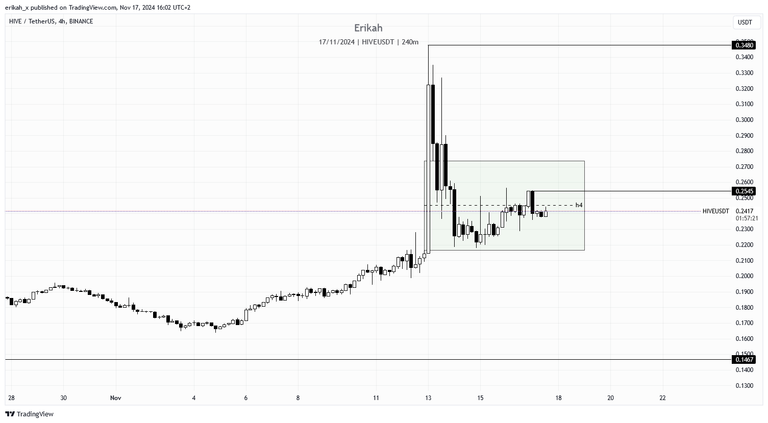
On a more granular scale, the h4 chart shows the gap created on the 13th. At the time of writing, price is inside the bullish FVG, slightly below the midline actually. For bullish continuation, price needs to close above $0.25845. Should price fail to do that, there's a chance for price to seek liquidity on the downside, which looks really great.
I don't like this price action to be honest, due to that huge wick/candle on the 13th. Low liquidity can create such a price action in case there's a bigger order placed and I think this is just the beginning. We've seen these wicks before, here and there, especially during Asia, and chances are deep pockets are going to stock up before the big run. Anyway, it is what it is, we trade what the chart gives us.

Let's have a look at what $BTS is doing, shall we?
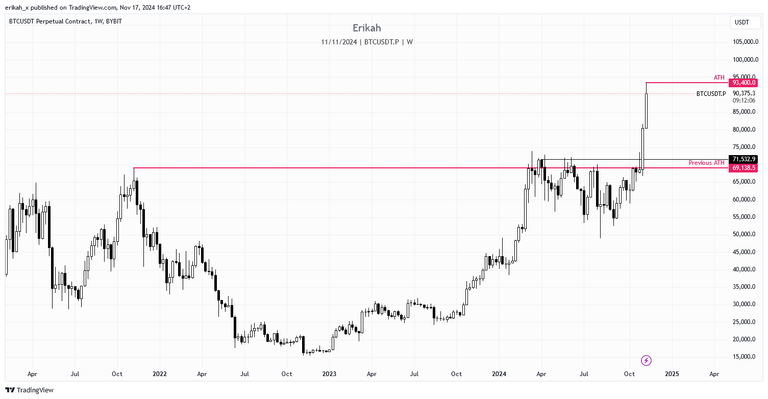
After establishing a new ATH, and printing 2 considerable bullish candles on the weekly, at the time of writing, $BTC is trading at around $90372. There are a few hours left till the candle close, some things can change, but I don't think the current candle can close bearish. This means, should the candle close as it is, a bullish FVG is created, which acts like a magnet as it is basically a liquidity pool.
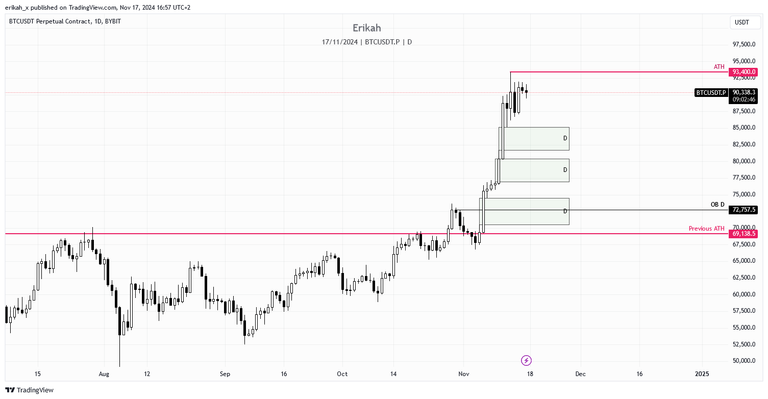
Seeing $BTC setting up a new ATH is exciting, especially when it is so high above the previous one, but price left 3 big gaps on the way up and I don't like it at all. The past few days were like consolidation, yesterday and today's price action can be seen as lack of volatility, which was expected as it's the weekend, but next week there's a huge possibility some of those gaps could be rebalanced. Let's wait for Monday low and Monday high to be set, then we'll see. Those gaps will be rebalanced sooner or later.
On HTF things are not looking bad, but as with any asset, price does not go up in a straight line, so please be careful.
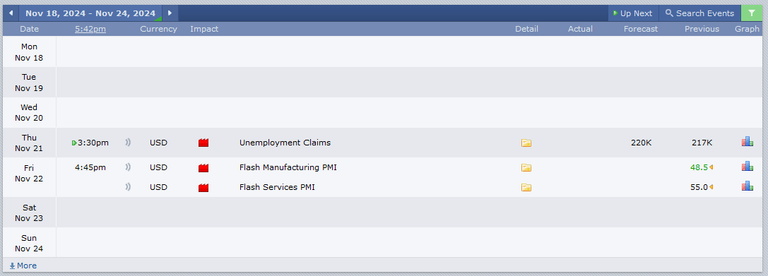
As far as the economic calendar is concerned, we have 2 red folder days next week, of which I think only the unemployment claims can move the market, but who knows. It's good to be ready to trade the market both ways.
Stay safe, be smart and preserve your capital.
As always, this is a game of probabilities, not certainties. Also please note, this is not financial advice, it's my view and understanding of the market.
All charts posted here are screenshots from Tradinview.

If you're a newbie, you may want to check out these guides:
- Communities Explained - Newbie Guide
- Cross Posting And Reposting Explained, Using PeakD
- Hive Is Not For Me
- How To Pump Your Reputation Fast - Newbie Guide
- Tips And Tricks & Useful Hive Tools For Newbies
- More Useful Tools On Hive - Newbie Guide
- Community List And Why It Is Important To Post In The Right Community
- Witnesses And Proposals Explained - Newbie Guide
- To Stake, Or Not To Stake - Newbie Guide
- Tags And Tagging - Newbie Guide
- Newbie Expectations And Reality
- About Dust Vote And Hive Reward Pool, by libertycrypto27
