Today I'm going to do something I've never done before. Wait, that's not entirely true. I'm doing this all day, every day, but I've never posted TA on Hive before. Yesterday I was thinking of charting Hive, as today is the last day of the week, then I thought, if I do this anyway, I might as well share it with you on Hive. Most likely no one is going to read it, which is more than fine by me, but who knows.
Before I start, please note, this is not financial advice! It is how I see the market at the moment.
Because I've never shared such an analysis before, let's start with the monthly chart and then move down to lower time frames.
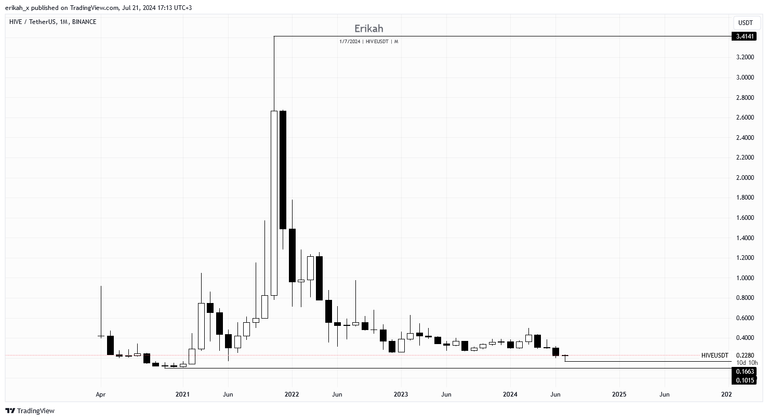
Looking at the monthly chart, things are not looking quite rosy for our token. At the moment of writing, $HIVE is trading at $0.2277, which is the level the token was trading at in June, 2021, almost three years ago and it's million miles away from its ATH.
On the monthly scale, $HIVE had three consecutive bearish candles. This month is not over yet, there are still 9 days left till this candle close. So far this month's candle is bullish, but again, we have to wait for the candle to close to know for sure if we finally have a bullish candle, or we register another bearish candle.
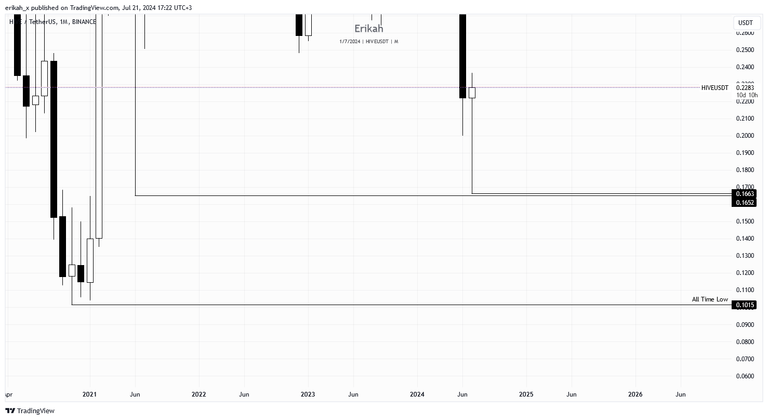
There's something interesting to note here. This month we had a huge drop and price got close to the level $HIVE reached in June 2021, but interestingly price did not sweep that low. These relatively equal lows usually work like a magnet, but let's hope we don't revisit that level.
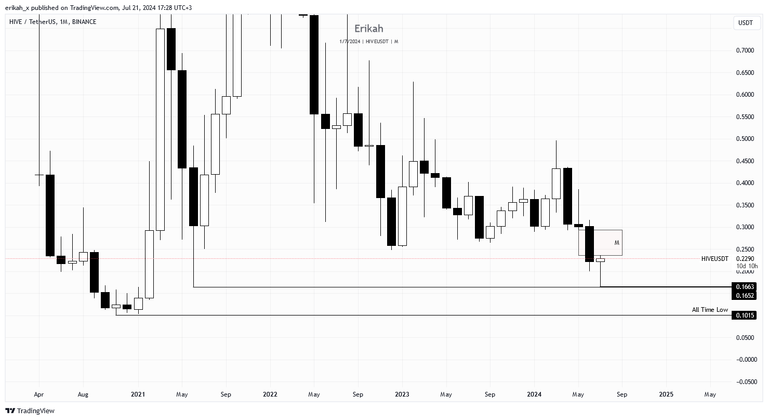
As I mentioned above, the month is not over, the monthly candle is not closed yet, but should it close like this, it's going to leave a bearish fair value gap (FVG).
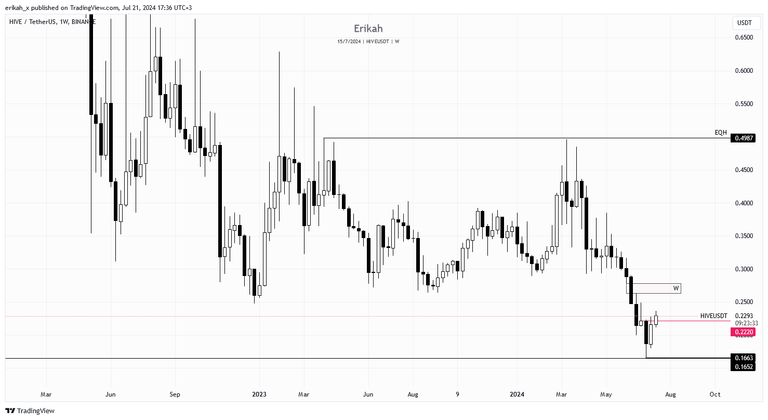
Looking at the weekly chart, things are a bit more clear. Price had a nice bounce at the $0.1663 level. Last week we had a nice bullish candle, but price did not manage to close above and confirm the order bloc (OB). At the time of writing, there are approximately 9 hours left till the weekly candle close, and for bullish continuation, the candle has to close above the dark pink line.
I'm a liquidity based trader, so I'm looking for liquidity pools, which means old highs, old lows or fair value gaps. On the last leg down, or on the sell side, price is looking pretty balanced, except that single bearish FVG, which could reject price. Should price close above the FVG, inverting it, we could see price seeking liquidity higher. We have some nice relative equal highs at the level of $0.4987, which would be the next level to look at.
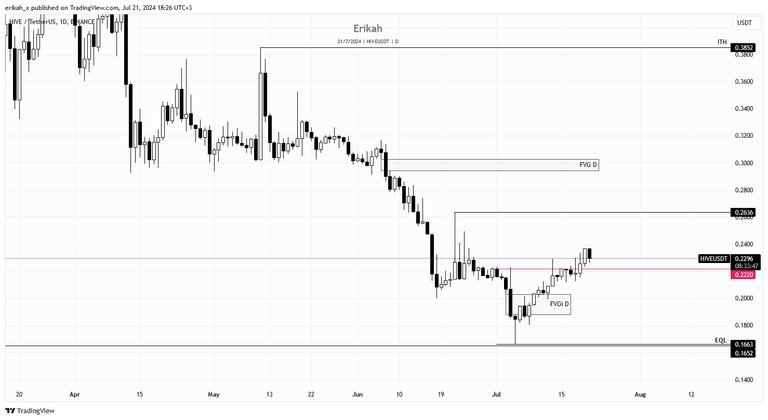
On a daily scale, we can see price bounced off the $0.1663 level nicely. It took five days to close above the FVG and invert it, so I wouldn't call it a V-shape recovery but let's not forget we're talking about the daily chart here.
Friday's up-close candle confirmed the OB, which means bullish continuation. The immediate level I'm targeting on the daily is $0.2636, which then can act as support. In case that level holds, then I'm looking for price to rebalance the bearish FVG above it, invert it, which would mean bullish continuation to higher levels, like 0.3852. Otherwise we can see a retest of lower levels.
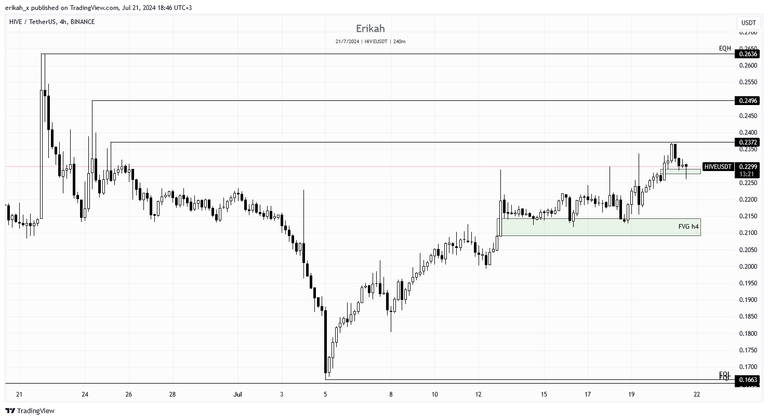
Driving down to a lower time frame, on the h4 (which for me, as a scalper, means high time frame but it doesn't matter in this case), you can see we had an FVG at $0.2143 level, which has managed to hold price nicely so far. We had another bullish FVG recently, a skinnier one, which was rebalanced today and at the time of writing, it's supporting price nicely. If price manages to stay about this FVG, there are some nice, untapped equal highs at $0.2372 that can work as nice liquidity pools. In case price closes above and manages to hold that level, the next level I'm looking at is $0.2496 and then $0.2636. In case the current FVG can't hold price, we could see a retest of the previous FVG.
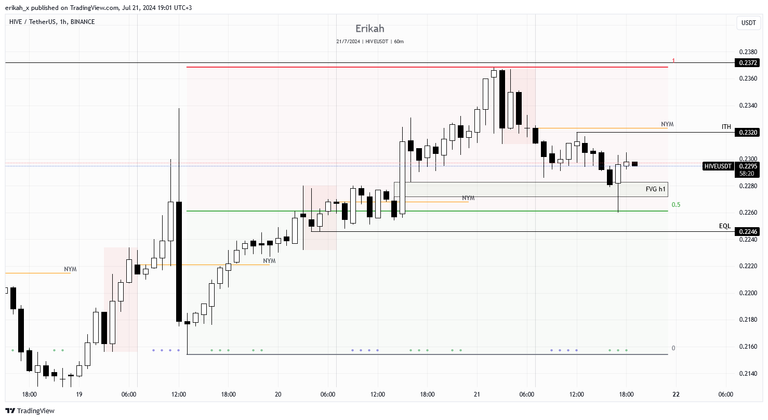
On a more granular scale, looking at the h1 chart, drawing up my dealing range, you can see price rebalanced the bullish FVG, bounced off mid-range and is in premium territory right now. So far the FVG is holding price, which means the next level I'm looking at is the intermediate term high (ITH) at $0.232 and then $0.2372. If the FVG fails to hold price, I'm looking at the last wick as liquidity pool as there are stop losses placed there, or those nice relatively equal lows below it.
In an ideal world, we short from premium and long from discount area, but there's no perp option for Hive, only spot, which complicates things quite a bit.
So this is how I see the market at the moment. Again, this is not financial advice, any action you take is at your own risk!
Also please note, $HIVE is a different animal, it's not like any other asset out there. We've seen huge candles coming out of nowhere, catching everyone off guard. Thread with caution, please!
All charts posted here are screenshots from Tradinview.
I'm not sure if I'm going to do this on a regular bases, maybe if there will be requests I can drop some TA from time to time, but this was fun.
Later Edit
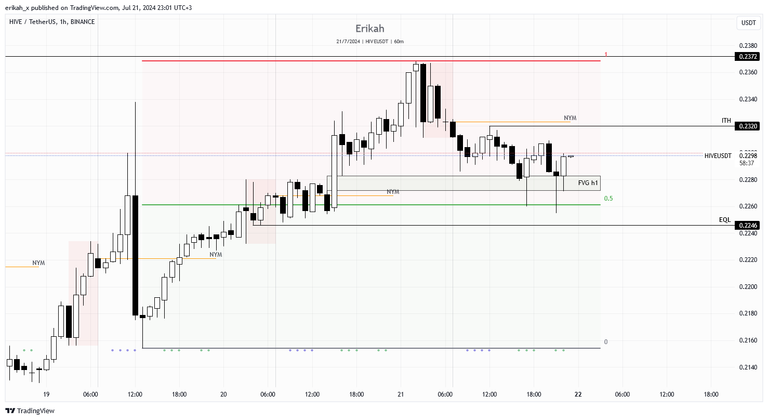
I'm dropping an update here. About an hour ago the news broke out about President Biden dropping out of the presidential race. We all know any news can move the markets, especially risk assets can have a sharp reaction to news.
If we look at the charts, most of the assets wicked down and we got a V-shape recovery. $HIVE also reacted to the news, but the h1 candle closed above the bullish FVG and it is also a bullish engulfing candle. So far so good.

If you're a newbie, you may want to check out these guides:
- Communities Explained - Newbie Guide
- Cross Posting And Reposting Explained, Using PeakD
- Hive Is Not For Me
- How To Pump Your Reputation Fast - Newbie Guide
- Tips And Tricks & Useful Hive Tools For Newbies
- More Useful Tools On Hive - Newbie Guide
- Community List And Why It Is Important To Post In The Right Community
- Witnesses And Proposals Explained - Newbie Guide
- To Stake, Or Not To Stake - Newbie Guide
- Tags And Tagging - Newbie Guide
- Newbie Expectations And Reality
- About Dust Vote And Hive Reward Pool, by libertycrypto27


