In this post I documented how we can investigate supicious accounts with publicly available data on team submission times in Splinterlands. As part of that, and based on some feedback, I realized that I did not really know how bots behave.
- Do they submit their team quickly or slowly, or something in between?
- And how do human players behave?
So in this post, I will use team submission data for a large number of battles to establish these references. Once we know what a human typically plays like, and what a bot typically does, it will be easier to use team submission times as an indicator of bot activity in Splinterlands, for the modes where this is not allowed by the TOS.
Also, the data is just interesting to look at, and I can use it to learn some new statistics methods. This time I learned about KMeans with scikit-learn.
The data was collected from the Splinterlands API with the same approach as outlined in the last post. All numbers reported here are the durations from finding an opponent for a match, to the team was submitted.

Submission time distribution, Modern VS WILD
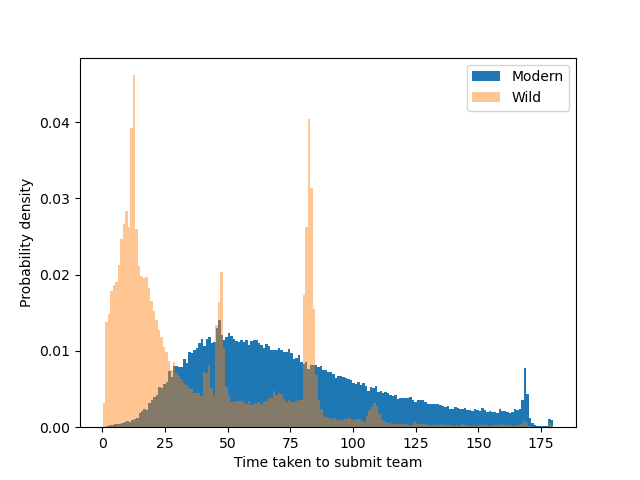
Based on 100 000 matches in wild and modern, here is the distribution of team submission times in the two formats:

There is a very clear distinction between the two formats. That is hardly surprising, since wild consists of somewhere around 95% bots, according to one SPL team member, and modern is dominantly human players.
In modern, most matches are submitted around the 50 seconds to 1 minute mark, but the tail is longer on the late submission side.
For wild, the most common submission time is just about 12 seconds, and there are also some spikes in the distribution, probably representing different types of bots. It is extremely uncommon for bots to submit later than 2 minutes in.
We can have more fun with this data. Lets see what machine learning can tell us about the types of players we have...

KMeans clustering
I used the KMeans implementation provided the skikit-learn package. It is very simple to use:
# Input observations
X = match_times

# Import the KMeans class
from sklearn.cluster import KMeans

# Initialize the KMeans object with 6 clusters
KM = KMeans(n_clusters = 6)

# Identify clusters in the data set by calling the fit method of the Kmeans class:
KM.fit(X)

# Now the KMeans object contains the cluster identity of each observation in
# the variable called labels_   We can print it to see the values:
print(KM.labels_)
I processed the battle submission times for each player into a set of five quantiles evenly spaced between 0 and 1. The quantile numbers now represent for example the upper bound of the player's 16.7% fasted submitted battles, the upper bound of the 33% fastest, etc.. With 5 quantiles we have the fractions 1/6, 2/6, 3/6, 4/6 and 5/6.
The quantiles are a simplified representation of the player's submission time distribution. We can compare them among players to find out if there are good groupings of player types.
Modern player types:
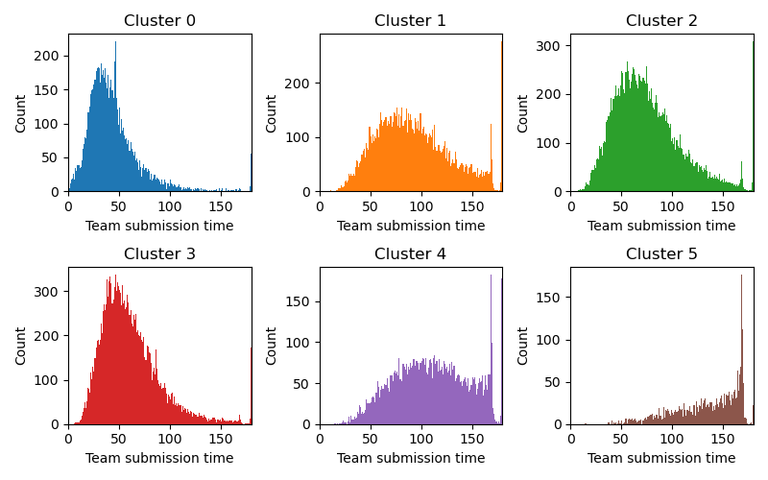
These are the six types of modern players identified by the KMeans approach:

And here are the fraction of players that are placed in each cluster:
| Cluster 0 | Cluster 1 | Cluster 2 | Cluster 3 | Cluster 4 | Cluster 5 | |
|---|---|---|---|---|---|---|
| Percentage | 0.12 | 0.19 | 0.27 | 0.27 | 0.12 | 0.04 |
Cluster 0 represent the quickest players. The most common submission time in this group is 30 seconds, and only rarely do they spend much more than a minute to submit. Clusters 2 and 3 are somewhat similar, but with most typical submission time around 50 and 70 seconds, respectively. These are also the most common groups to be in, and represent your average player. Clusters 1 and 4 are the players that drag out a bit more, and somewhat frequently run into the submission deadline. Finally, cluster five are a bunch of people that really like to use all available time to submit.

Wild player types:
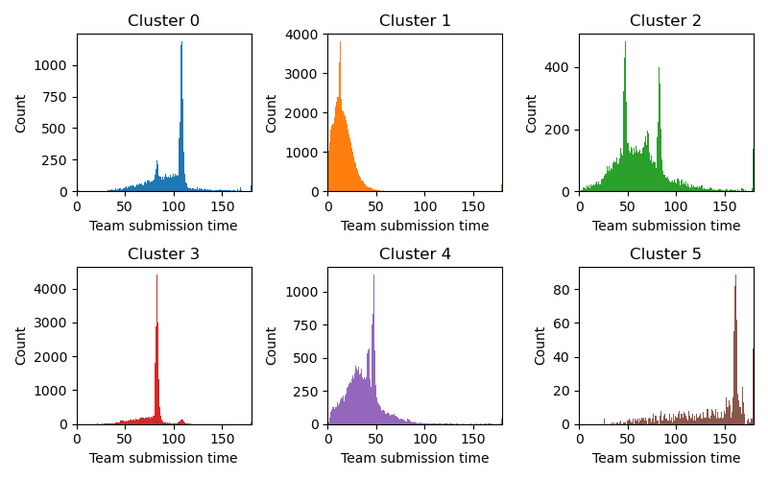
Here are the types of players in wild that this method identifies:

And here are the fraction of players that are placed in each cluster:
| Cluster 0 | Cluster 1 | Cluster 2 | Cluster 3 | Cluster 4 | Cluster 5 | |
|---|---|---|---|---|---|---|
| Percentage | 0.09 | 0.46 | 0.09 | 0.18 | 0.16 | 0.01 |
Obviously, these groups are completely different from the modern results. Each group has a spike at a pretty specific submission time. In cluster 0, its at 106 seconds, cluster 1 has a spike at 12 seconds, etc.

Final words
I found it quite fun to work with this data. Splinterlands offers a good data set to play with and test data analysis methods.
I hope you found this post interesting. If you have not yet joined Splinterlands please click the referral link below to get started.
Best wishes
@Kalkulus

