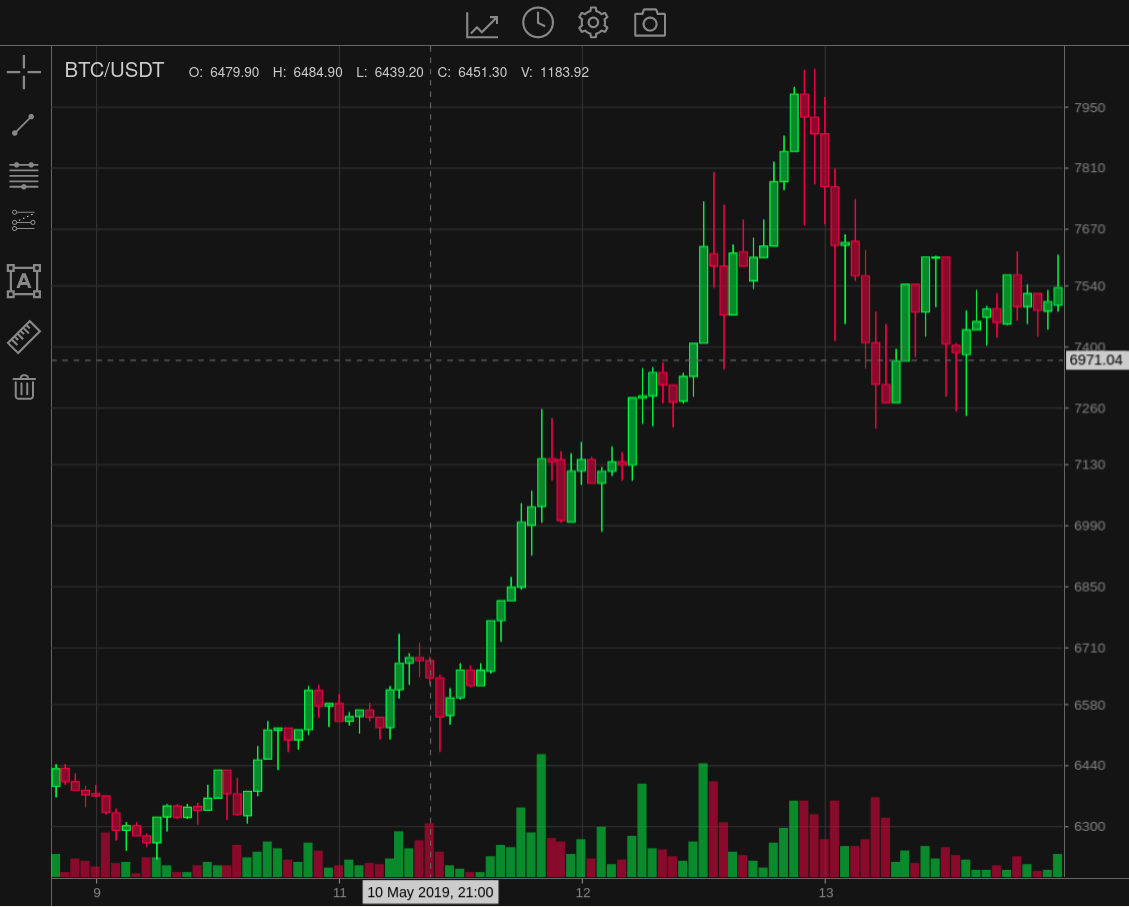
I have not posted in a while as I've been deep deep down the programming rabbit hole. I'm pleased to say the news is good. Progress is being made.
- Improvements in the X (time) and Y (price) axes, but more work needed
- User input can now be handled, mouse, keyboard and touch
- Because of user input, the chart can now scroll through price history
- X and Y axes update on scroll
- Cursor - highlights position on the X (time) and Y (price) axes
- Icons in the Utils (top) Tools (left) bars fire events when clicked
- Chart legend (top left) displays, open, high, low, close, volume
- State Machine - available to each component part
The two most important advances listed above are the user input and state machine. The combination of these two now allow for complex and interdependent behaviours to be built.
Using the state machine, a component part can subscribe to a custom event from other component parts, change state, execute code and in consequence, emit new custom events which in turn trigger a cascade of state changes elsewhere, just as interlocking parts of a complex machine work together. Hence why this methodology is called a state machine.
I did a fair amount of research to arrive at the above solutions. There are many excellent off the shelf libraries, but often intended for large applications and hence also their code size.
So it took time to track down or even write from scratch, solutions that were light weight and yet flexible enough.
When it came to starting the implementation of the Tools and Utils bars, the hard work paid off. It was a relatively simple and painless task to wire up the logic for them to interact with the rest of the chart.
I now feel confident that the more complex tasks ahead can be successfully completed.
Posted Using LeoFinance Beta