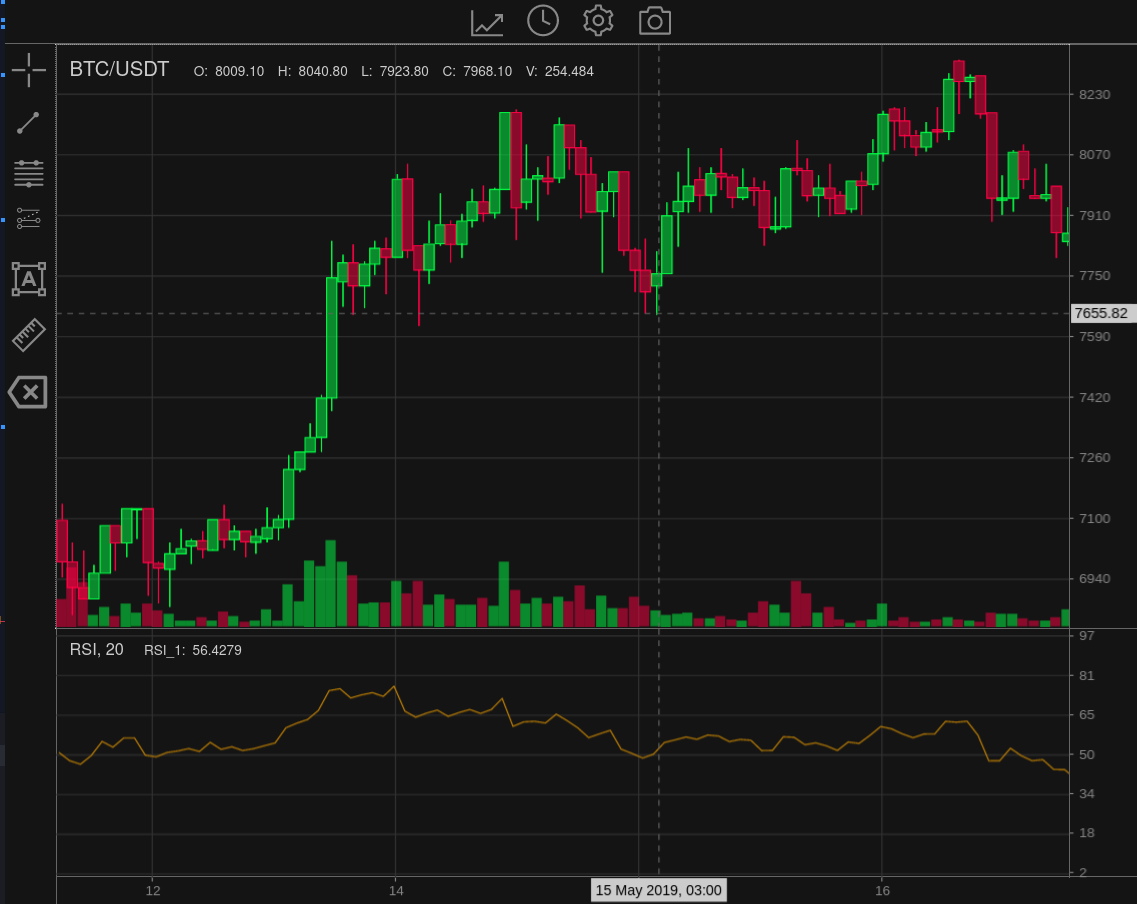
With crypto crashing hard at the moment, I've more than once mused if there will be much of a crypto market left for me to use my trading chart on when I finally complete it. I guess I'd better hurry up!
I picked some low hanging fruit today as I was procrastinating somewhat on the main task at hand, but I'll post about that when it is done.
Having set up what looks like a reasonably robust internal signalling system for events and responding to them, I decided to add some keyboard control to the chart.
Previously you could only scroll the chart via mouse click and drag action.
The proof of theory held true that it was relatively easy to plug in keyboard control. The js-input-control library provides easy keyboard even management. After capturing the key event I use my own custom event propagation. Major components of the chart use their own individual state machines which are subscribed to events of interest. These then control the logical flow of actions triggered by the custom event.
This means that the underlying code which updates the chart is unaware of whether it was a mouse or keyboard event which invokes it.
With this modular approach, I will eventually be able to expose the functionality via a public API, permitting developers to trigger the chart update via their own conditions.
The lack of or the ease of external chart control has been one of my greatest motivations for programming this chart. After talking to other developers working on their own trading app projects, this was one of the most common points of frustration.
With technical analysis, everybody has their own "secret sauce (source)" for processing and automating technical analysis of price data and other related datasets. So good visual feedback, a customized graphical representation, is paramount for the average human mind to process vast amounts of abstract information.
Posted Using LeoFinance Beta