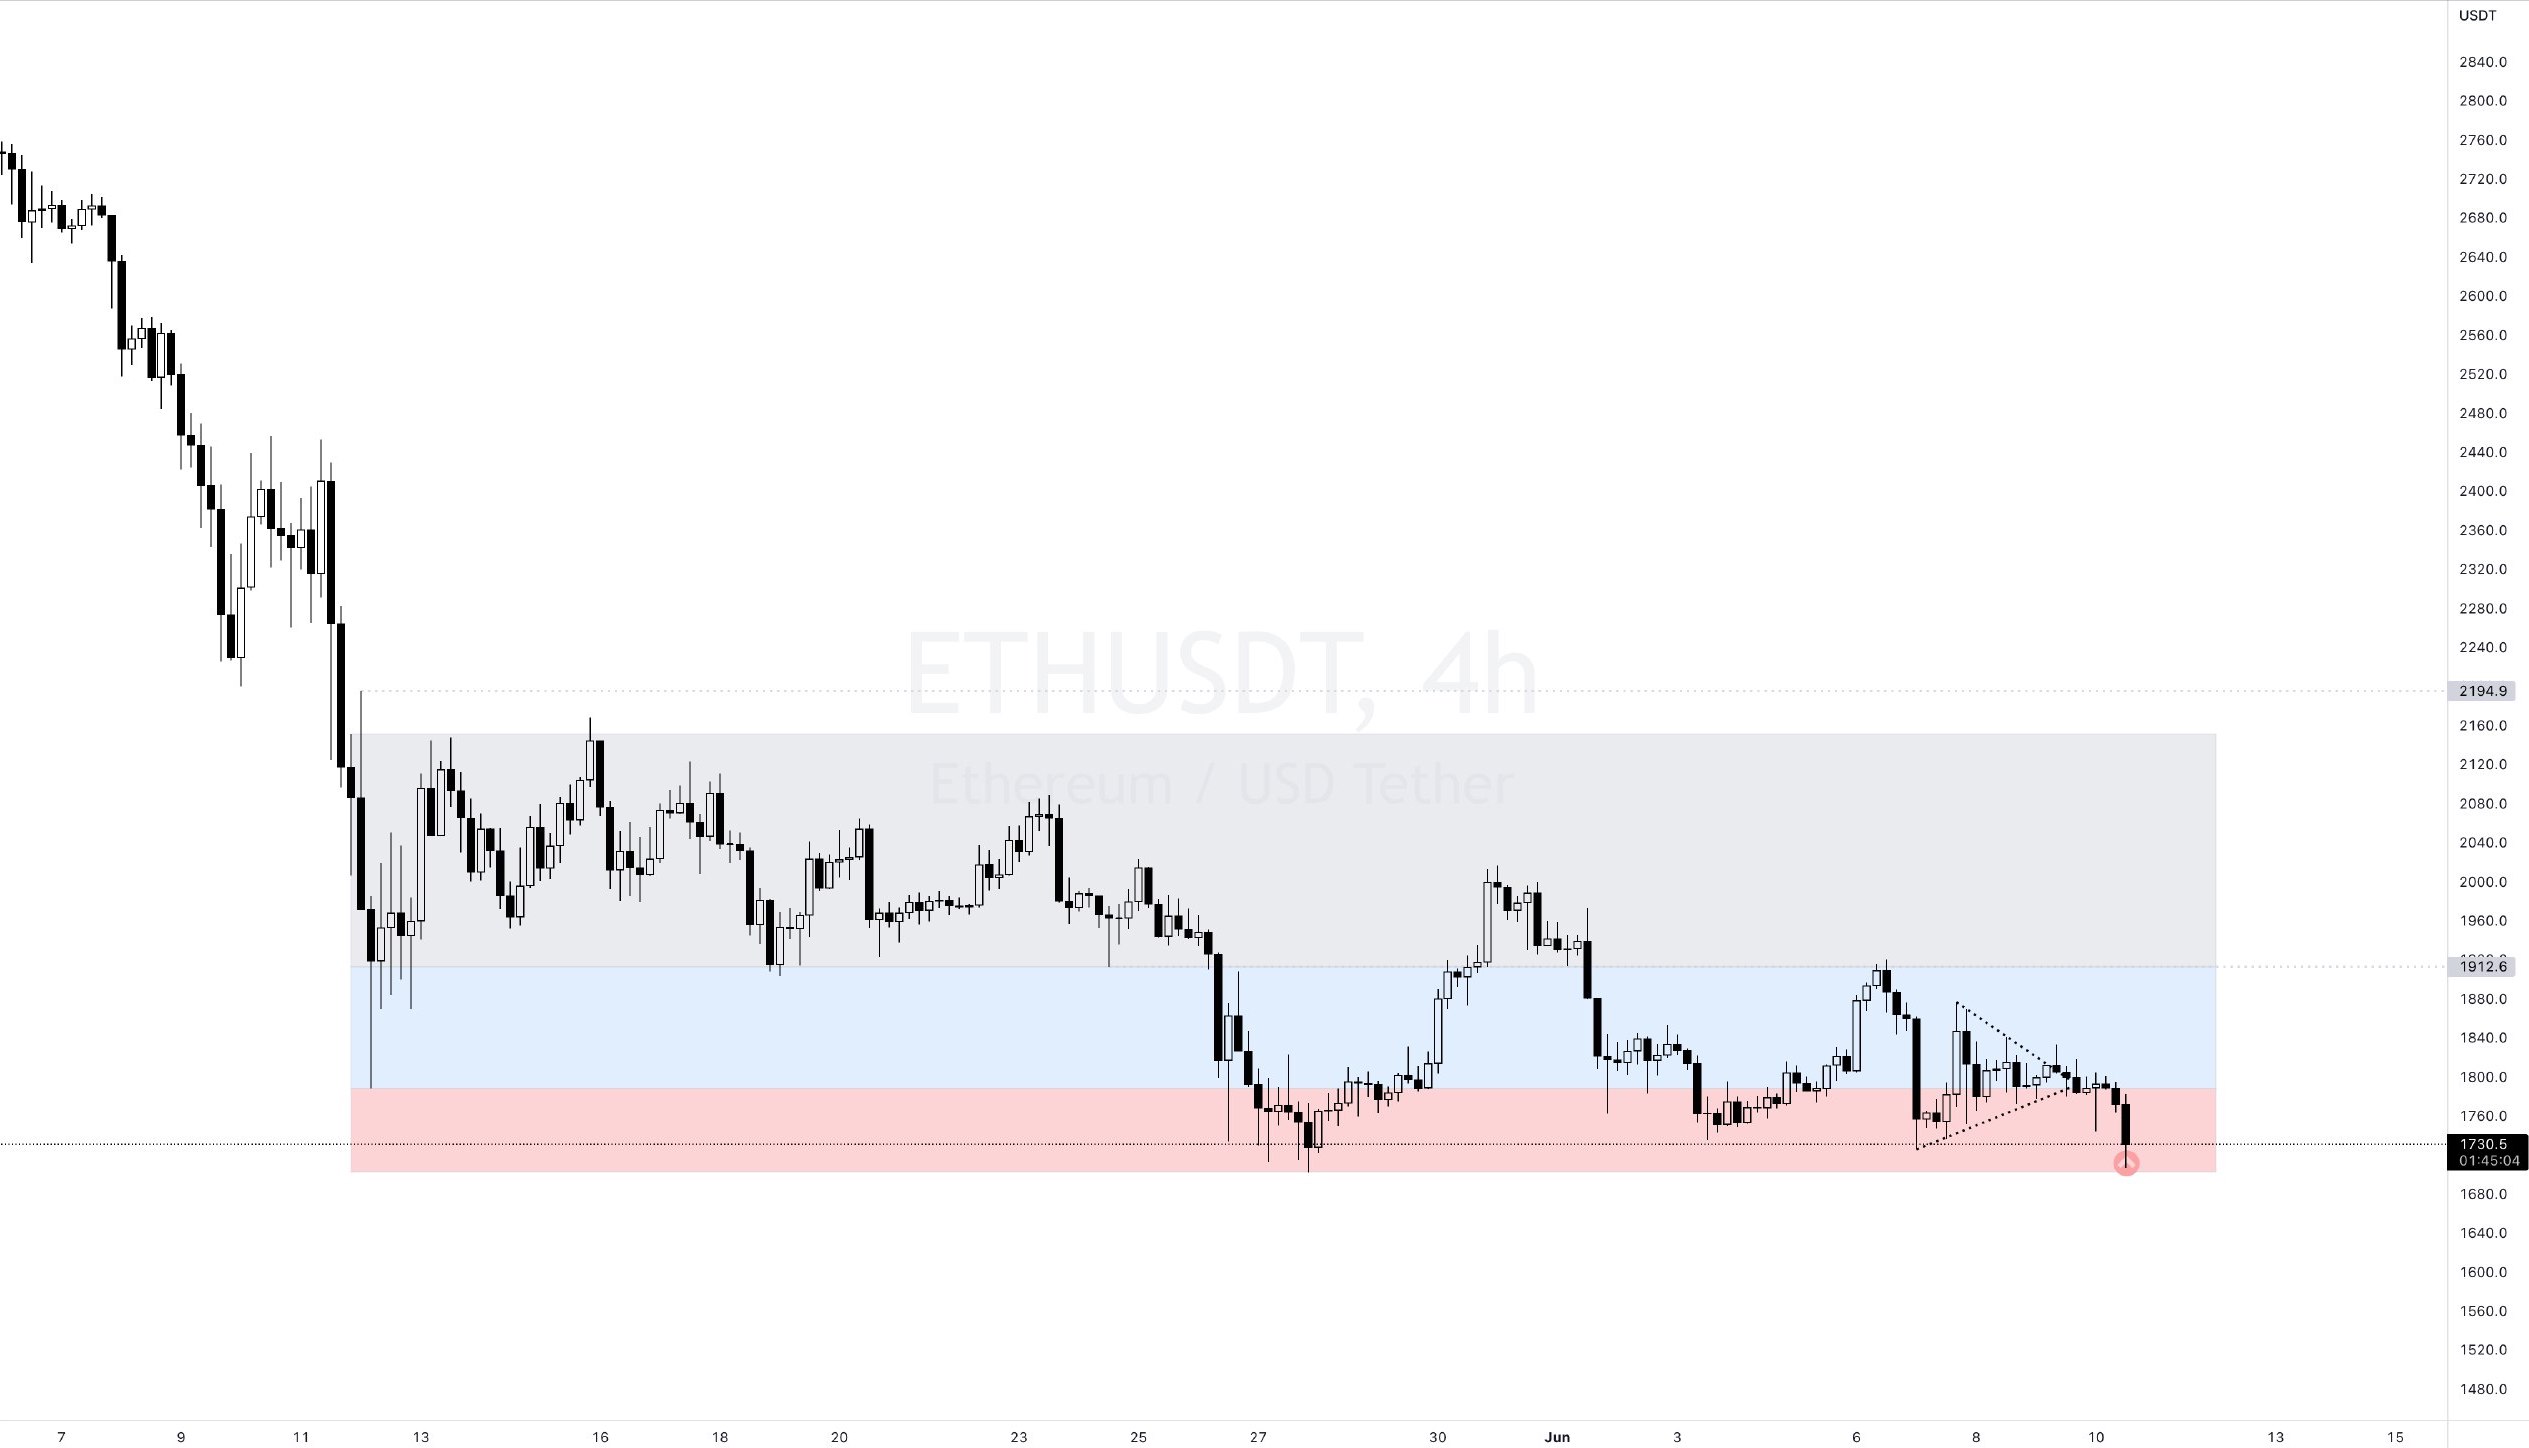
$ETH
We have touched the level of 1700 USD, as long as the reaction from here remains weak, we can descend below the 1700s and into a very dangerous zone, but 1700 is very important because the 500-day neckline of ETH passes here.
If the 1700s are lost, we will be looking at the 1400-1100 numbers that I mentioned in the macro analysis before, but the loss here should be permanent, that is, it should be in the form of a weekly close and next week, in a downward format. If it loses and then regains, then it turns into a short squeeze.
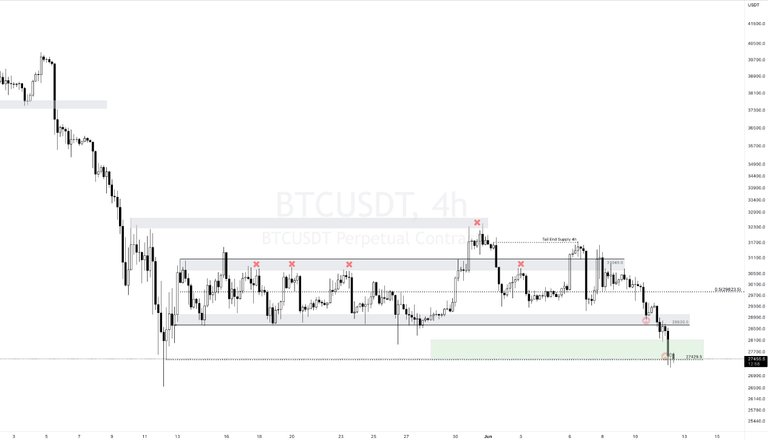
$BTC
Bugün haftanın son günü ve hafta sonu düşüşleri ile epey bir yol aldık eğer akşam üstü yukarı sürmezler ise aşağı yönlü gap'li açacağız.
Kısa vade pozisyonlanma için;
27600 üzerine geçerse o zaman alım yönlü saatlik kapanışları konfirmasyon olarak kullanarak 28.2 ve 28.7 civarına kadar şansınızı denersiniz. 27.4 altında kapanışların devam etmesi (30min 1h) zayıflık göstergesi olarak değerlendirilebilir.
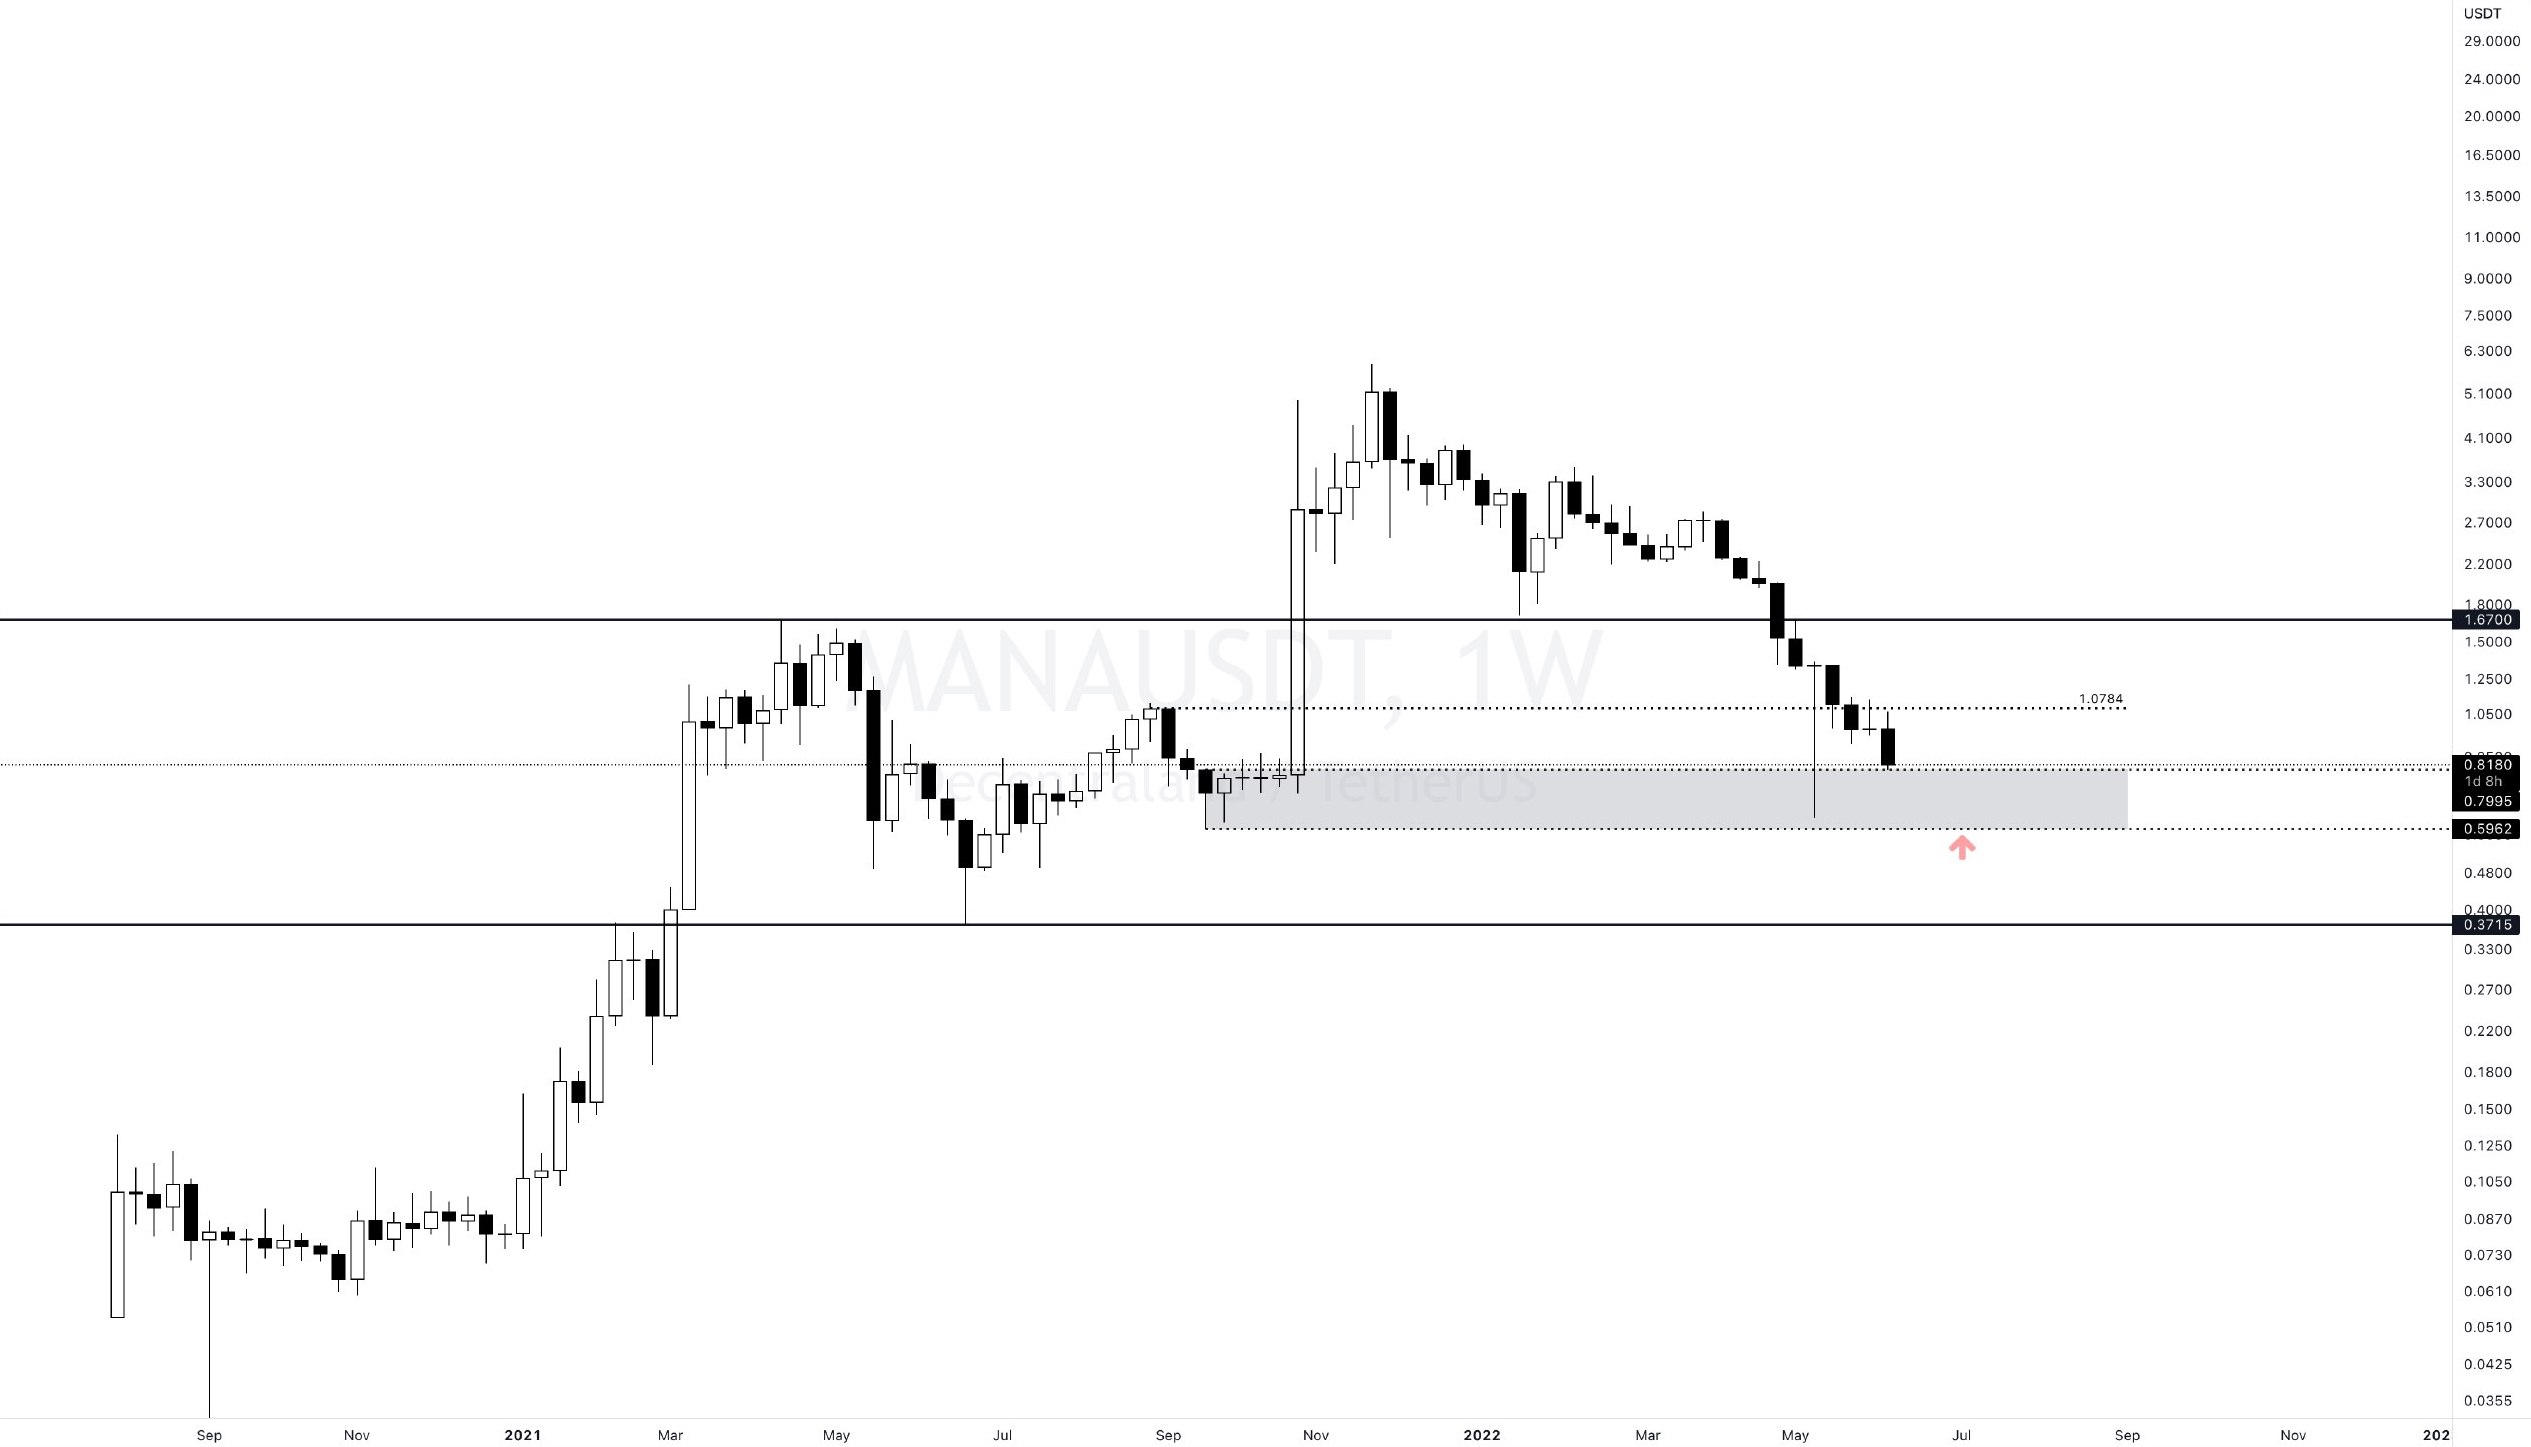
We gave the final analysis of $MANA on June 1st. My expectation was that if the weekly close does not come above 1.07, the bottoms will remain weak and it will go down to around 0.79 and then around 0.59.
Dropped around 1.06 -> 0.81 (25%;).
There is support around 0.79, there may be a reaction here, if the weekly close is below this, we will look around 0.59.
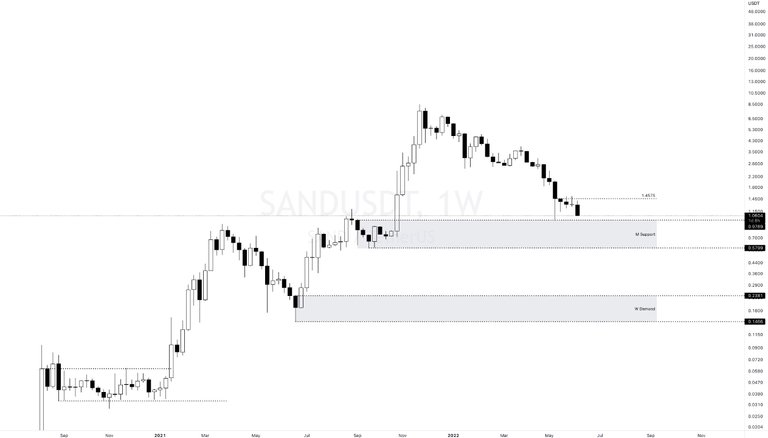
We said that if $SAND fails to close above 1.53, 0.95 and 0.57 can be considered as the next bearish targets.
1.40 -> 1.06 (24%)
There is support around 0.97, if there is no reaction here and a weekly close occurs below 0.57 in the coming weeks.
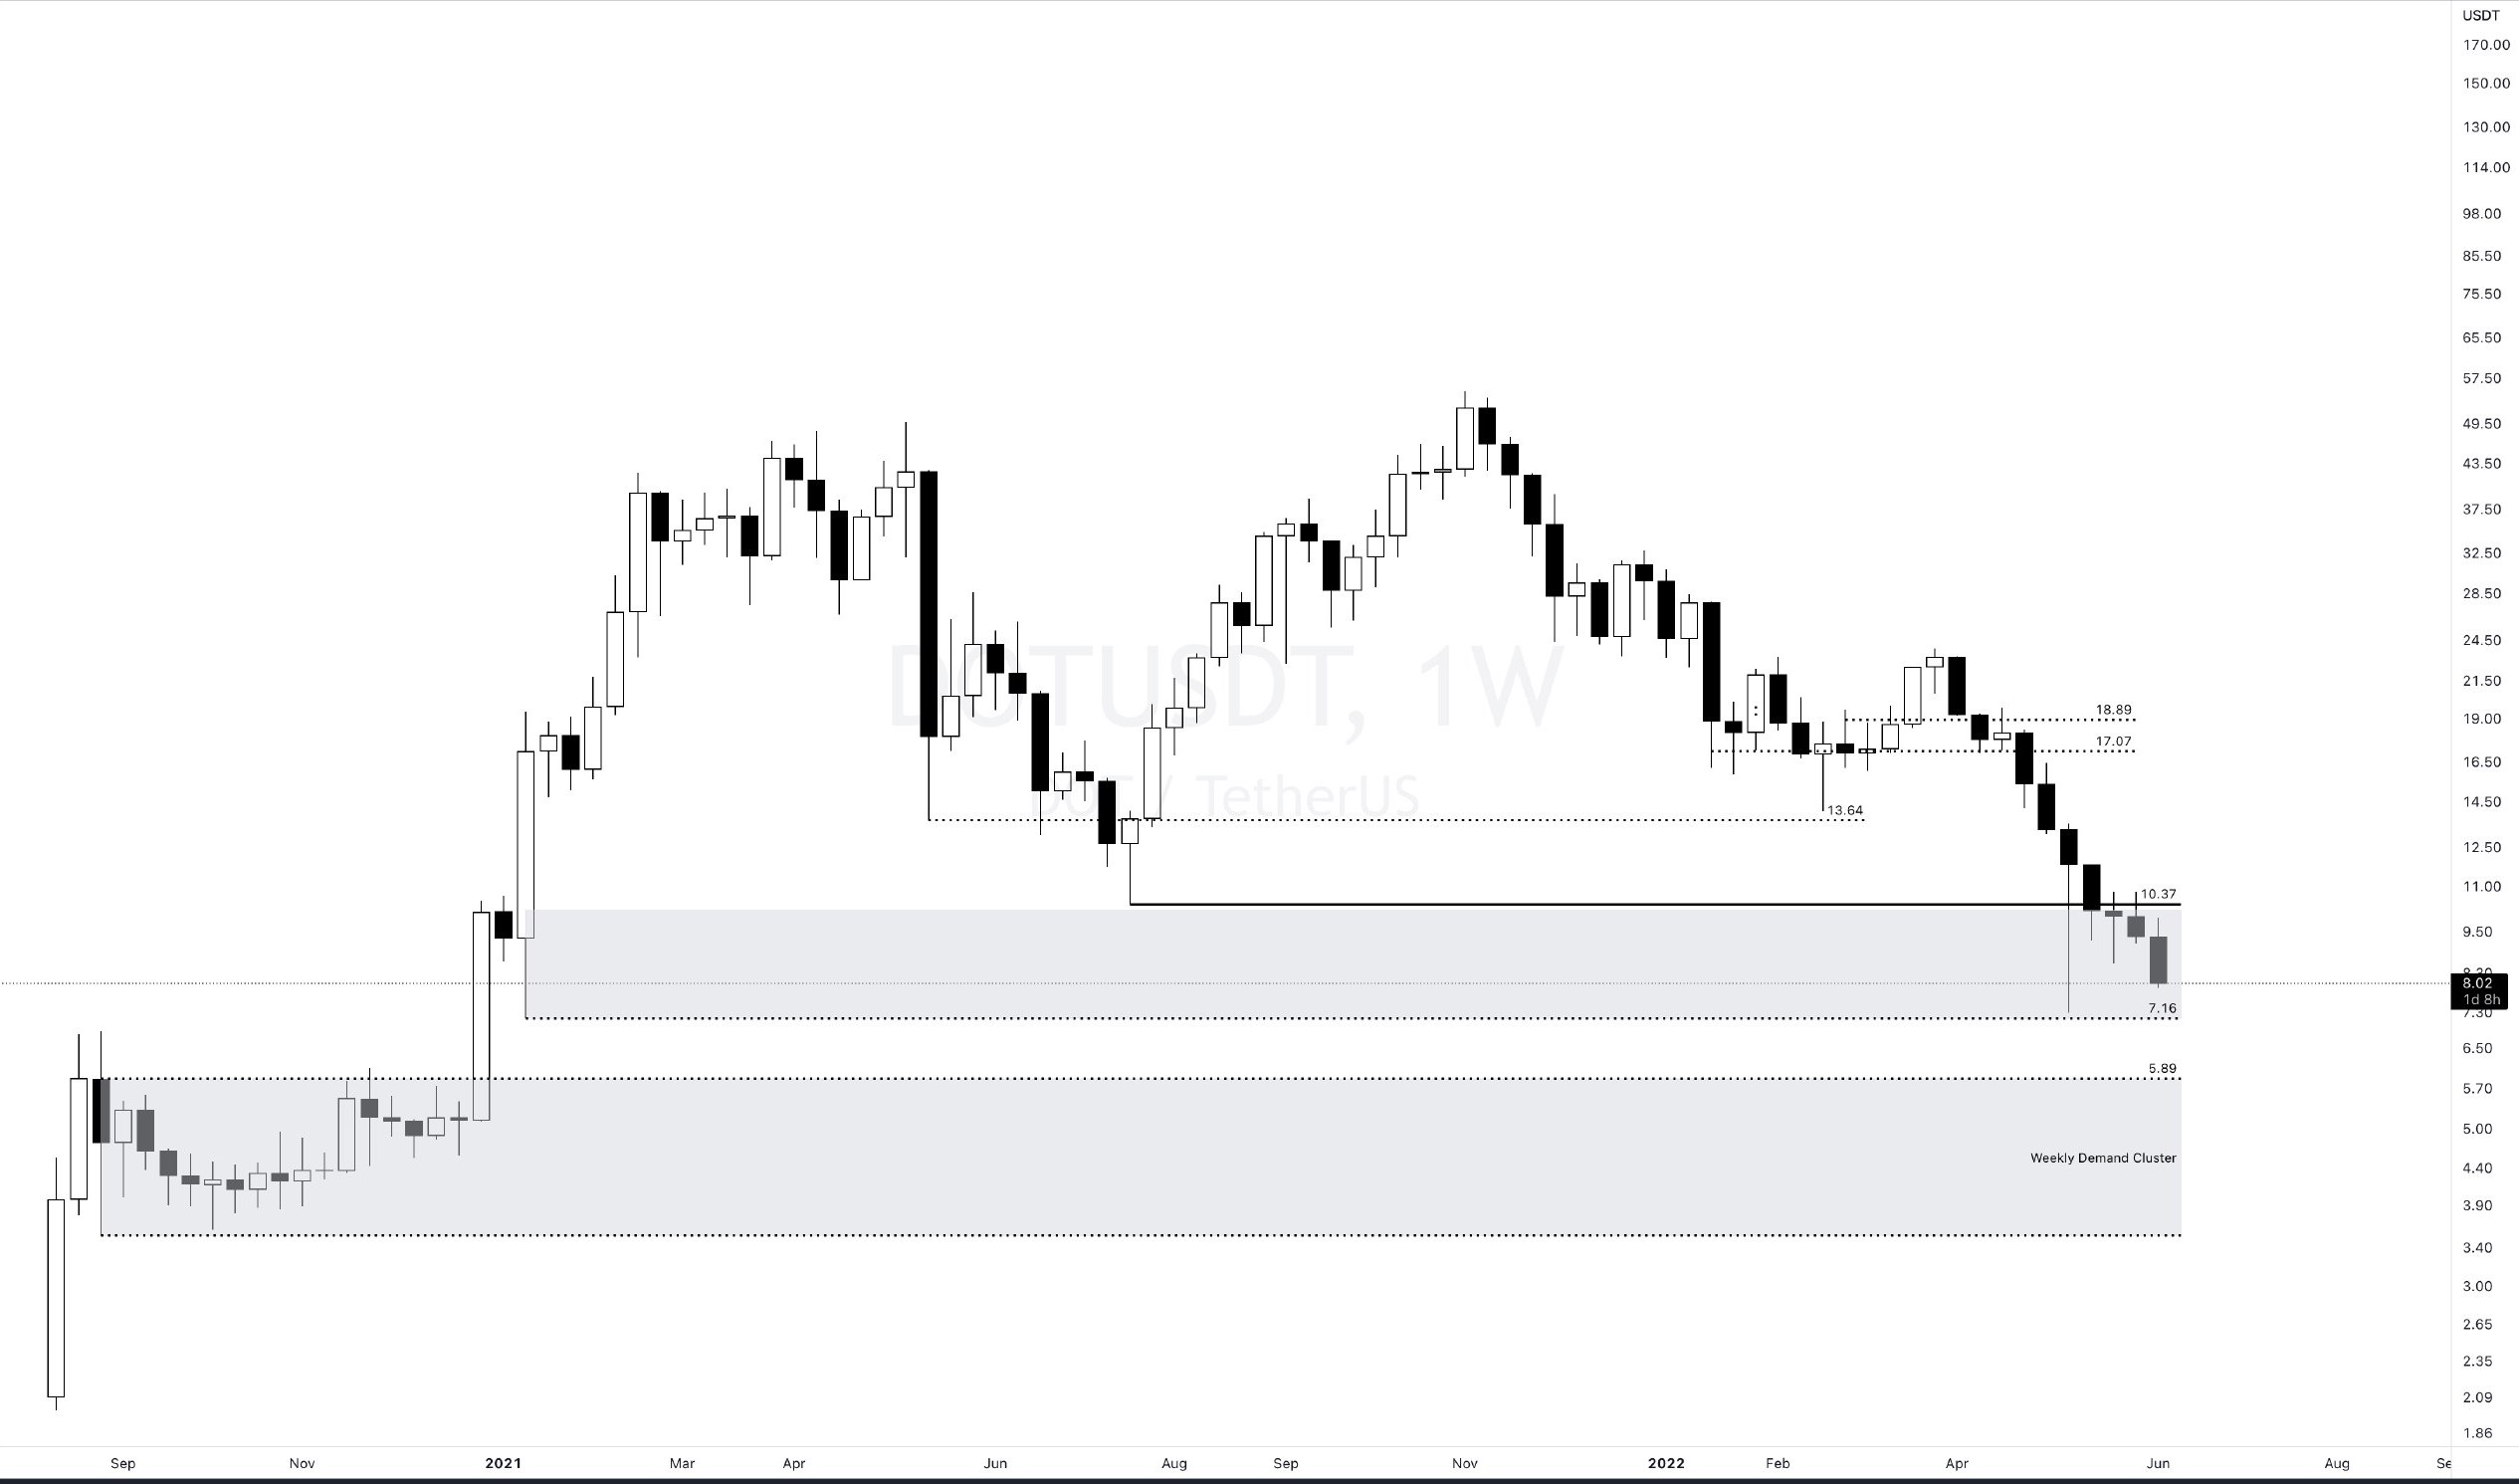
We said that if there is a weekly close below $DOT 10.37, we can look at 7.30/7.16 and 5.89.
10.33 -> 8.03 (24%)
Here, around 7.30/7.16, the first support is available, especially in the weekly closings, 5.89 is looked at.
If there is a reaction around 7.30, it will be checked whether it will be rejected at 8.50.
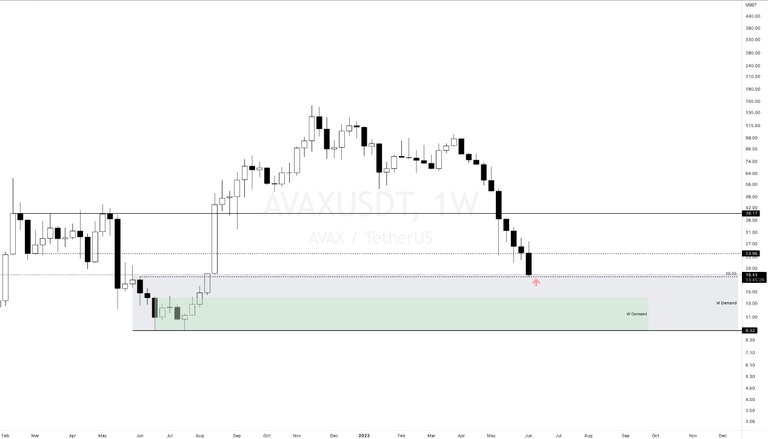
$AVAX has arrived at an important support that was previously displayed on charts. If there's going to be a reaction, it should be here today or tomorrow.
Let's put it in numbers, the 18 USD support level is of great importance in monthly and weekly.
With the weekly close below, 13 and 10 USD levels are looked at. Weekly closing on it, especially today, if there is a sudden reaction purchases, then I will see if there is weakness for the short in the 24's. Since the decline is breathless here (for 10 weeks), a short squeeze that may come, frankly, will hurt a lot, those who have opened a short transaction in alt coins, be careful, make sure to use a stop and realize 50% of the support.
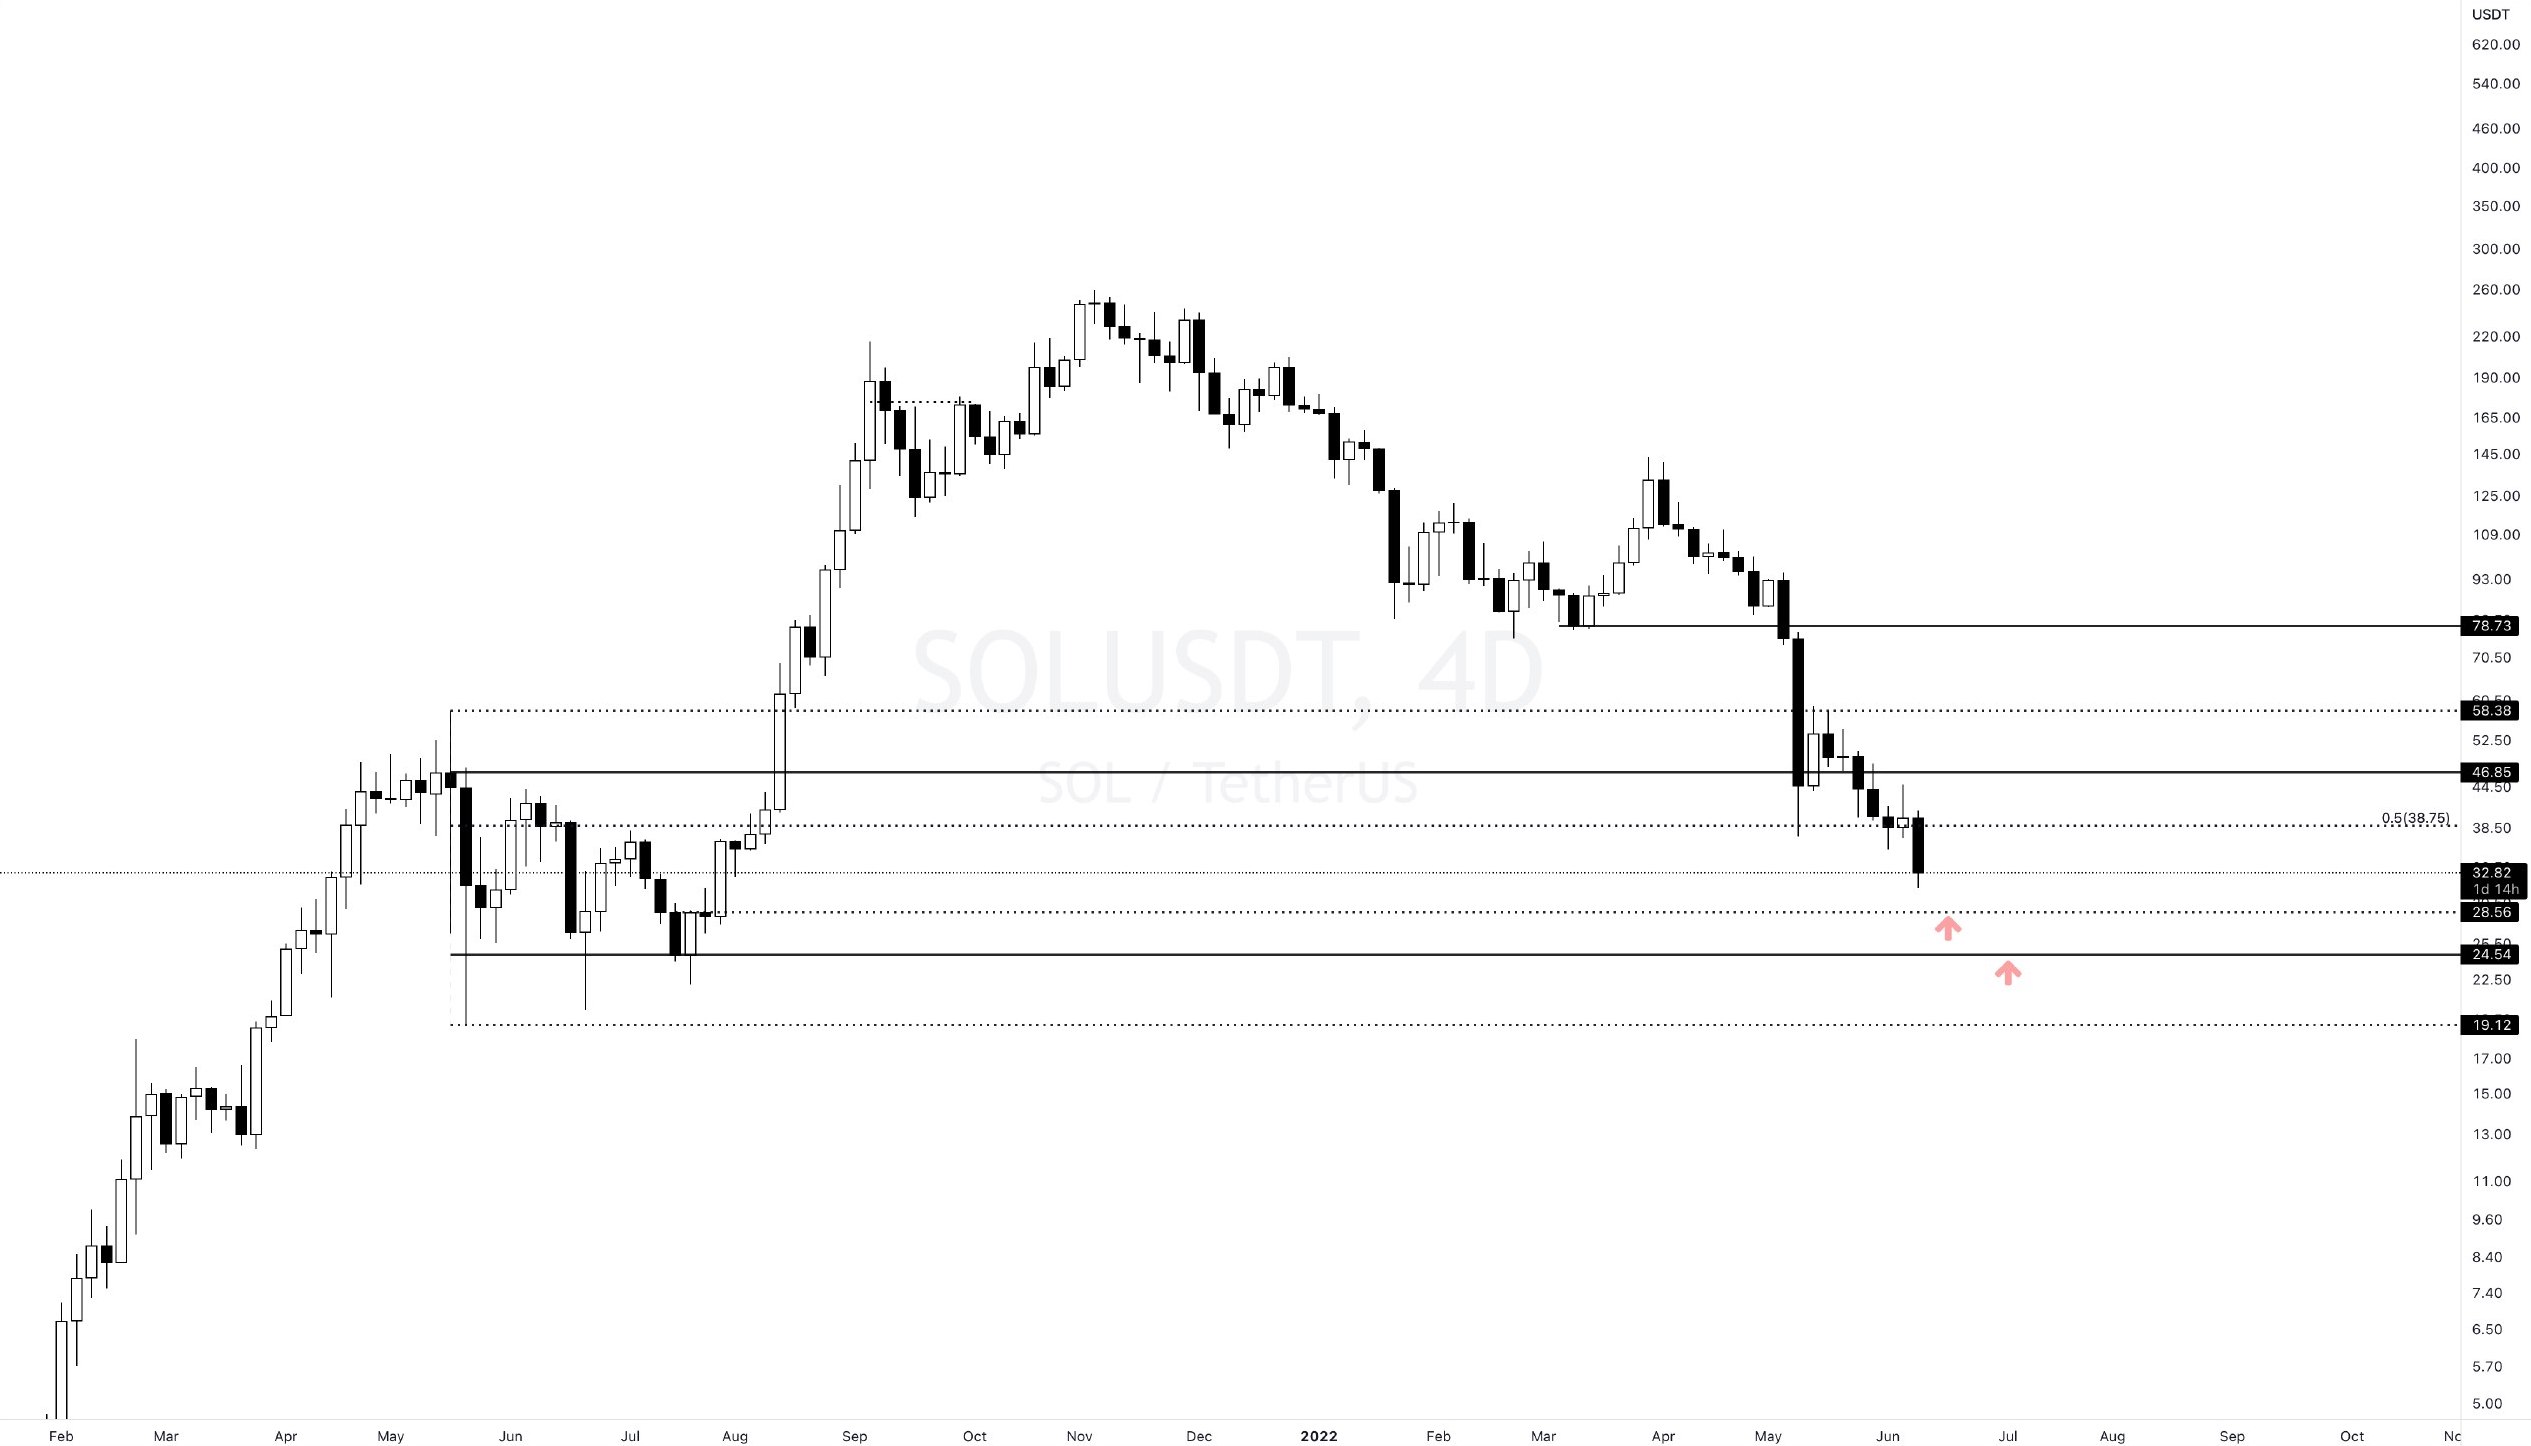
We said that if the $SOL weekly close is below 47, there is a high probability of continuing the decline towards the 26-19 price zone.
The point reached is a decrease from 47 USD to 31 USD. (35%)
$SOL gives bullish divergence (positive mismatch) warnings. We can get a very serious reaction within 1-2 weeks.
A drop as low as 29/24 USD is possible for now. Following the analysis I gave at the 47 USD level, if there is anyone on the short side, they can follow these targets with a maximum of 25% of the position, there is no need for more risk. Be sure to realize it. Do not open new shorts!
Good luck with,
It is not investment advice.
Graph Source: Tradingview
Posted Using LeoFinance Beta