This is a second look at our HP Whales
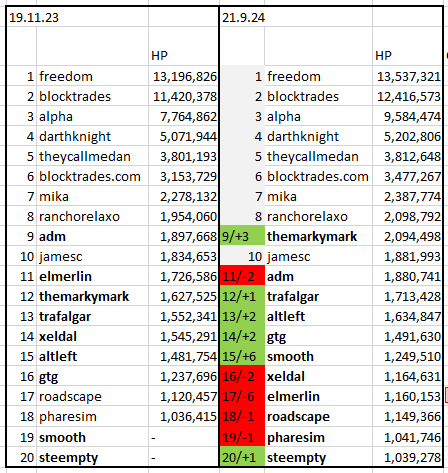
Previously we saw that the spots for the top 20 HP whales had seen quite a bit of change over the last 10 months. Together they hold a bit over 37% of all HP with the top 5 holding around 25%.

How has their HP changed?
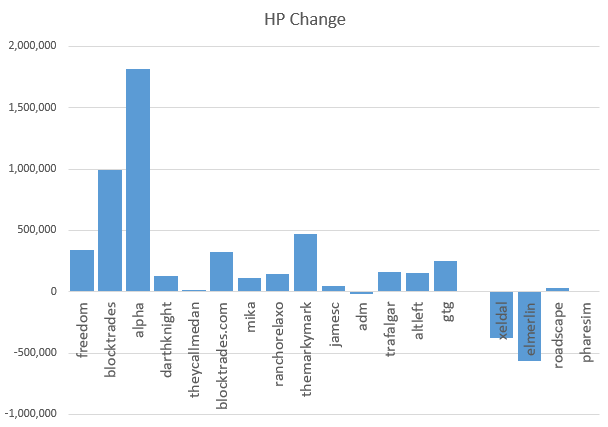
When we compare their HP stake over the last 10 months we can see a big difference. Keep in mind, however, that there is a big change of total HP throughout these spots. Having 10M HP could of course lead to a potentially much larger increase than someone holding "only" 1M HP simply through the inflation HP holders get which is around 3%.

@Alpha has gained a massive 1.8M HP in not even a year, followed by @blocktrades with almost 1M. Other whales have generally grew their stake by less than 500k and we only have 3 whales which reduced their stake: @adm @xeldal and @elmerlin with the latter having over 500k less HP.
How much realized HP?
An interesting question that arises is how much of their max. potential HP gains did they actually realize. In other words, if we assume that users on Hive can earn roughly 3.1% from inflation + 8.5% from curation rewards totaling around 11.6% (I am using 10% as we are looking at a time span of around 10 months), how much has their stake grown or decreased relative to that potential growth?
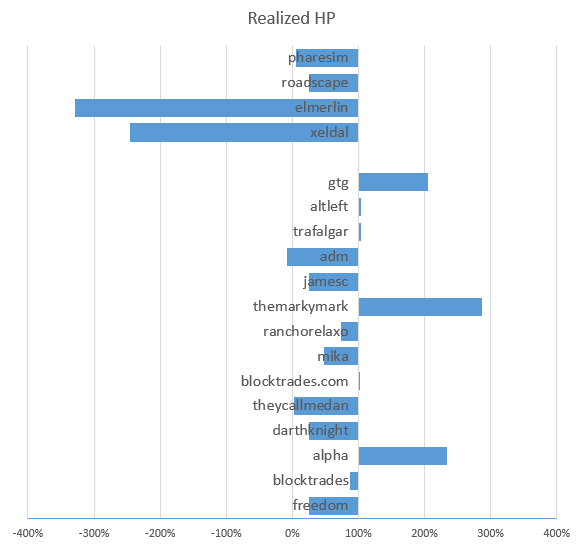
We can look at that by using the 10% potential growth as a benchmark and see how whales deviate from it. For example altleft had around 1.4M HP in 2023, so we would assume that he could hold as much as around 140k more HP 10 months later. Calculated as a percentage this actually checks out as the user holds 148k HP which is a relative increase of 103%. Any deviation is marked with a bar as seen here:

@Elmerlin, as expected has the biggest negative deviation of over 400% (axis is at 100%) and @themarkymark has the biggest positive deviation of almost 300%. This means that the latter user grew their stake by 200% more than their max. potential growth (300%-100%).
Absolute differences
While relative numbers gives us a way to compare whale's actions, the absolute numbers also hold an important fact: how much HP has actually been added or lost in the top 20?

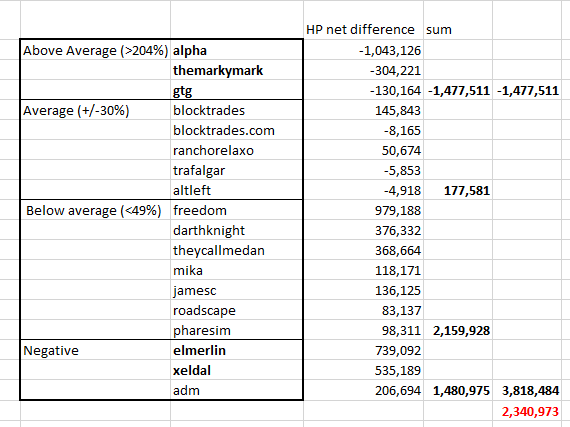
Here, negative numbers show an increase while positive numbers show a decrease.
We can group the whales in 4 categories showing their holdings in relation. These numbers can also be expressed in absolute numbers showing that 3 whales added almost 1.5M HP more than their potential maximum (over 100%). But the majority of whales held less than the 100% benchmark which means that they either did not curate and/or also powered down their HP. In total this is almost 4M HP that falls in this category. The net difference is around 2.3M HP.
Conclusion
As far as I know this is the first time someone has looked at what our HP whales are doing. Overall, I would say that it is pretty much what I expected: whales follow their own interests and have sold some of their massive HP interests on the market. But we can also see that some have gained even more HP than what they were expected and many also fall in the average category.
I don't think that a couple of million Hive of selling pressure in almost a year (again, some of the below average values also comes from no curation), is all too much in the grander scheme of things. Just yesterday we had almost $100M traded for Hive in a single day... That always blows my mind.


Check out the Love The Clouds Community if you share the love for clouds!
