Hello friends of $POB, Friends of $HIVE and all others,
here are the:
$POB Statistics For The Last Week:
The timeframe is from 2023-07-28 to 2023-08-04.
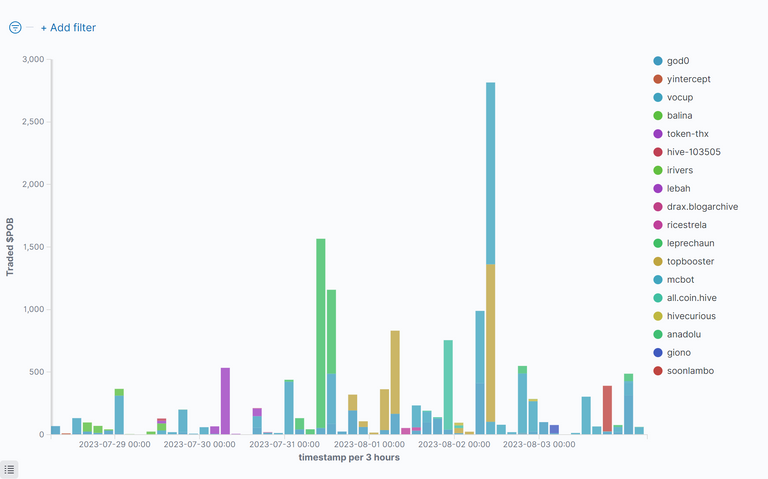
Bought $POB By Time
This figure shows who has bought how many $POB at which time:
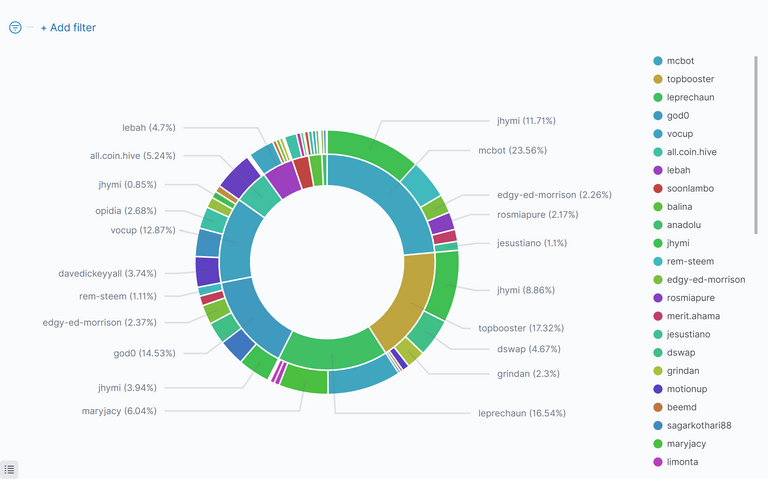
Top $POB Buyers And $HIVE Sellers
The inside of the circle shows the buyers of $POB, ordered by $HIVE they have spent. The outside shows the recipients of that $HIVE (sellers of $POB):
Commulated Amount Of Bought $POB Per Person
This figure shows the top 10 $POB buyers, how much they got and how much $HIVE they spend for this. It is sorted by $HIVE, that was spent:
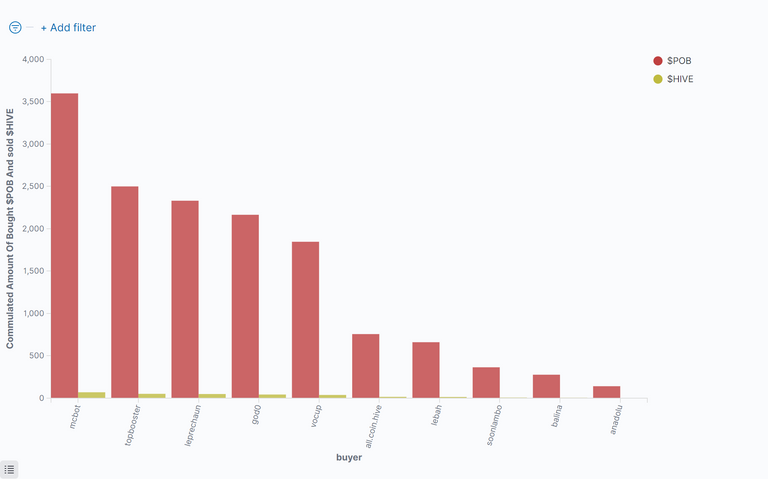
Table Of Top 20 $POB Buyers
This table shows the top ten buyers of $POB sorted by the $HIVE, they have spent:
| Buyer(Descending) | Sold $HIVE | % Sold $HIVE | Bought $POB | Avg. Price | Number of Trades |
|---|---|---|---|---|---|
| @mcbot | 69.72727 | 23.15 % | 3598.30379 | 0.01732 | 66 |
| @topbooster | 51.27220 | 17.03 % | 2500.00001 | 0.02051 | 17 |
| @leprechaun | 48.95527 | 16.26 % | 2331.20350 | 0.02100 | 14 |
| @god0 | 42.91663 | 14.25 % | 2161.11190 | 0.02016 | 166 |
| @vocup | 38.09276 | 12.65 % | 1846.52635 | 0.02089 | 46 |
| @all.coin.hive | 15.51689 | 5.15 % | 756.59098 | 0.02051 | 14 |
| @lebah | 13.90737 | 4.62 % | 660.84414 | 0.02104 | 17 |
| @soonlambo | 7.32599 | 2.43 % | 364.56969 | 0.02009 | 5 |
| @balina | 5.83190 | 1.94 % | 276.99809 | 0.02106 | 33 |
| @anadolu | 2.36578 | 0.79 % | 141.27140 | 0.01731 | 11 |
| @ricestrela | 1.70421 | 0.57 % | 82.99660 | 0.02071 | 10 |
| @giono | 1.32071 | 0.44 % | 66.03647 | 0.01950 | 3 |
| @hivecurious | 0.83388 | 0.28 % | 39.98252 | 0.02113 | 6 |
| @token-thx | 0.48035 | 0.16 % | 20.88461 | 0.02300 | 1 |
| @hive-103505 | 0.42170 | 0.14 % | 18.33467 | 0.02300 | 1 |
| @yintercept | 0.31922 | 0.11 % | 15.41143 | 0.01995 | 7 |
| @drax.blogarchive | 0.10000 | 0.03 % | 4.19053 | 0.02385 | 2 |
| @irivers | 0.04219 | 0.01 % | 1.77350 | 0.02380 | 2 |
| others | 0 | 0.00 % | 0 | 0.00000 | 0 |
| Sum: | 301.13432 | 100 % | 14887.03018 | 0.02205 | 421 |
Commulated Amount Of Sold $POB Per Person
This figure shows the top 10 $POB Sellers, how much they sold and how much $HIVE they got for this, sorted by $HIVE:
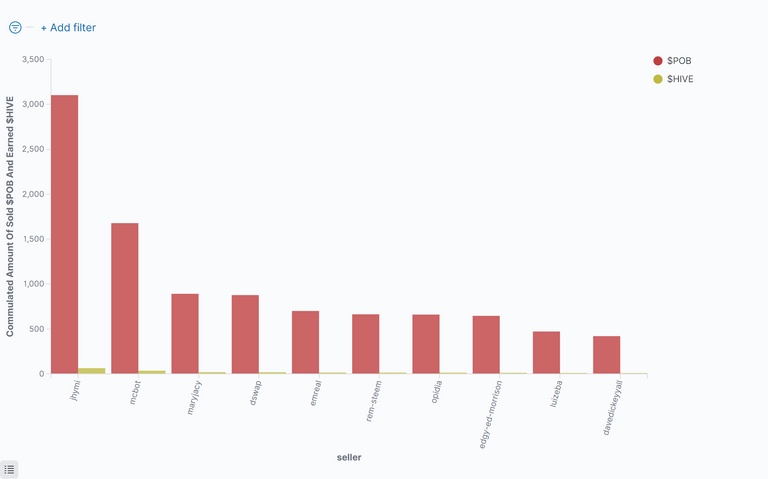
Table Of Top 20 $POB Sellers
This table shows the top ten sellers of $POB Sorted by the $HIVE, they have got:
| Seller(Descending) | Earned $HIVE | % Earned $HIVE | Sold $POB | Avg. Price | Number of Trades |
|---|---|---|---|---|---|
| @jhymi | 63.56026 | 21.11 % | 3102.08485 | 0.02046 | 10 |
| @mcbot | 35.24343 | 11.70 % | 1677.36096 | 0.02089 | 4 |
| @maryjacy | 18.70955 | 6.21 % | 890.93073 | 0.02100 | 3 |
| @dswap | 17.97543 | 5.97 % | 876.63270 | 0.02047 | 13 |
| @emreal | 14.35627 | 4.77 % | 700.00003 | 0.02051 | 3 |
| @rem-steem | 13.91856 | 4.62 % | 662.78866 | 0.02100 | 4 |
| @opidia | 13.57557 | 4.51 % | 659.81508 | 0.02067 | 8 |
| @edgy-ed-morrison | 11.75372 | 3.90 % | 645.79584 | 0.01950 | 7 |
| @luizeba | 9.67049 | 3.21 % | 471.52644 | 0.02051 | 2 |
| @davedickeyyall | 8.82000 | 2.93 % | 420.00000 | 0.02100 | 2 |
| @michupa | 7.84906 | 2.61 % | 471.11105 | 0.01700 | 6 |
| @grindan | 6.69559 | 2.22 % | 326.47241 | 0.02051 | 1 |
| @rosmiapure | 5.46010 | 1.81 % | 260.00463 | 0.02115 | 4 |
| @merit.ahama | 3.69983 | 1.23 % | 217.88174 | 0.01698 | 1 |
| @stea90 | 3.40541 | 1.13 % | 161.81654 | 0.02104 | 2 |
| @trumpman | 3.21985 | 1.07 % | 175.44952 | 0.01986 | 5 |
| @elderdark | 3.03672 | 1.01 % | 146.42026 | 0.02078 | 4 |
| @jesustiano | 2.75434 | 0.91 % | 150.65297 | 0.01828 | 1 |
| @motionup | 2.66134 | 0.88 % | 129.76502 | 0.02051 | 2 |
| @beemd | 2.60292 | 0.86 % | 125.19514 | 0.02125 | 5 |
| others | 52.16589 | 17.32 % | 2615.32561 | 0.01996 | 334 |
| Sum: | 301.13433 | 100 % | 14887.03018 | 0.01999 | 421 |
Price Of The $POB
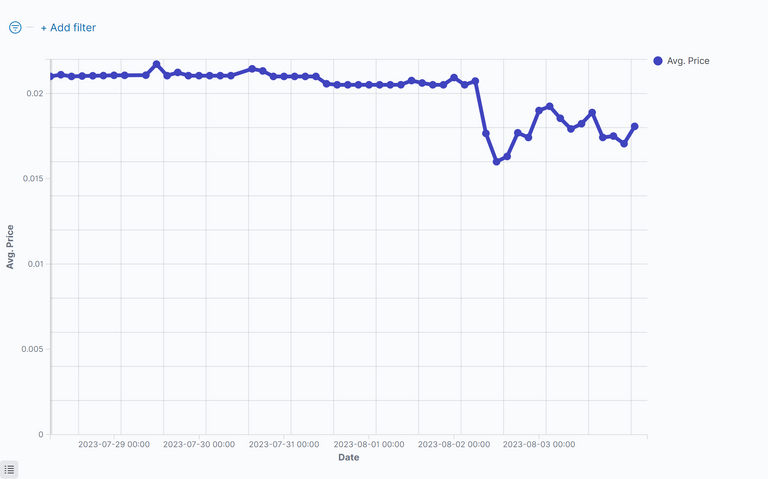
This figure shows the price of $POB for the last period:
$POB Summarize Metrics
This table shows how much $HIVE was given by buy-requests, that where equal or higher than the sell order vs. sell-requests, that were equal or lower than the buy order.
If the buy-requests where higher than the sell-requests, then money comes into the system and the value of the token increases.
Under the total line one can see the sum of $HIVE and sum of $POB that changed the ownership and the average price of $POB for the last period.
| Request | Received Hive | Received HIVE % | Sold $POB | Avg. Price |
|---|---|---|---|---|
| sell | 223.09075 | 74.08% | 11037.87503 | 0.01987 |
| buy | 78.04354 | 25.92% | 3849.15515 | 0.02036 |
| sum: | 301.13429 | 100% | 14887.03018 | 0.02012 |
Comparison With Other Tokens
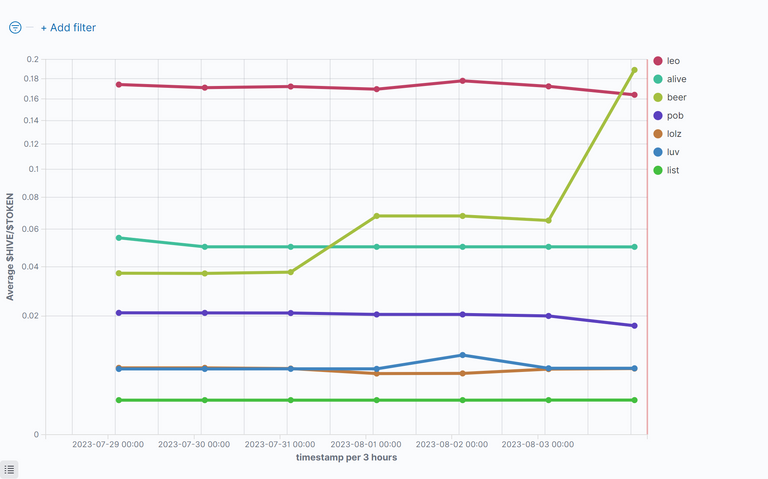
$HIVE/Token
This figure shows the value of $HIVE compared to some token for the last period. Be aware of the nonlinear (root square) y-axes.
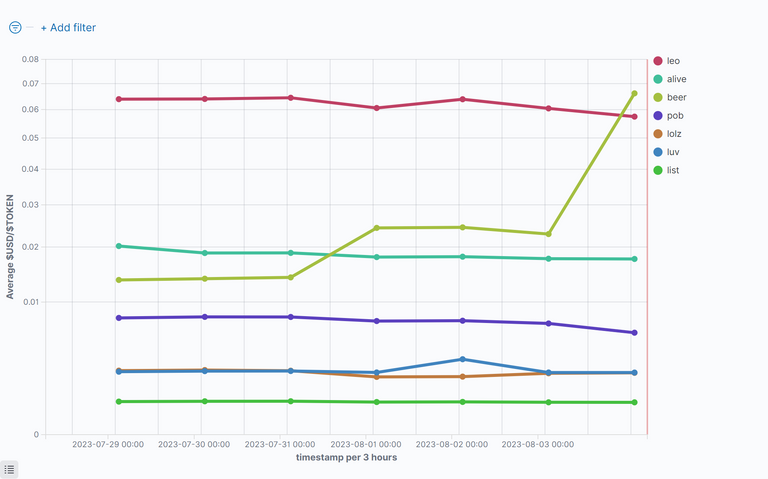
US-Dollar/Token
This figure shows the value of $USD compared to some token for the last period. Be aware of the nonlinear (root square) y-axes.
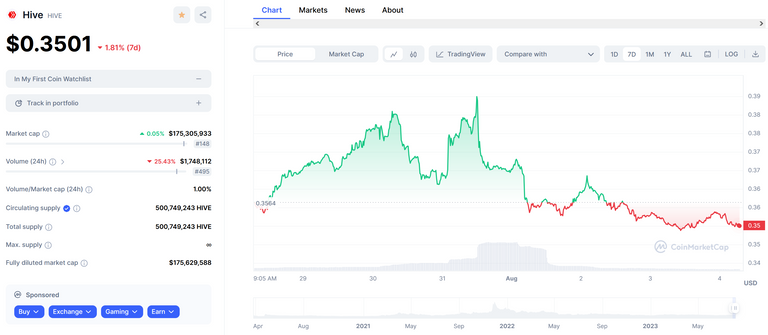
The HIVE rank in Coinmarktecap is: 148
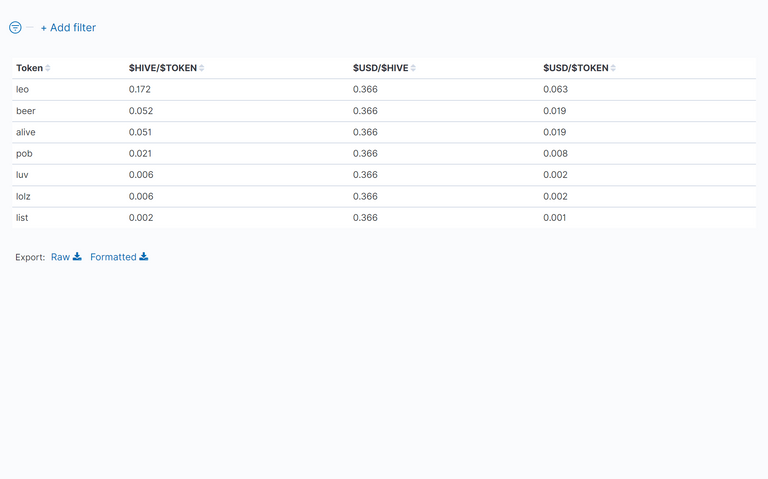
Table Of Token Prices in $HIVE and $USD
This table shows the average value of the prices of the token for the last period. One can see Hive and the US-Dollar compared to the token.
Disclaimer
All stats are without warranty.
They are taken from:
curl -XPOST -H "Content-type: application/json" -d '{ "jsonrpc": "2.0", "method": "find", "params": { "contract": "market", "table": "tradesHistory", "query": { "symbol": "TOKEN"}, "limit":1000, "offset": 0 }, "id": 1 }' 'https://api.hive-engine.com/rpc/contracts'
I have put them into logfiles and uploaded them to Kibana, from which I took the screenshots.
If you find errors, please tell me!
If you want me to continue the stats, give me some good upvotes ;-)
If you want to see other statistics (even from totaly other data), please contact me. I can create them weekly or monthly if I get some rewards for it.
For more details see here: How I Have Set Up Elasticsearch And Kibana On My Raspberry Pi To Monitor Token Activities and here: Do You Want To See Statistics Of Your Favorite HIVE Token? or on github.
Here are the stats from the other tokens I observe: https://peakd.com/@achimmertens/posts?filter=stats
Remark
All the Hive and HivePower, which is generated with this post, goes to @anobel. He donates the Hive to people that do good things and post about it.
You may follow him and support his work. See his latest post:
Regards, Achim Mertens
