Hello friends of $POB, Friends of $HIVE and all others,
here are the:
$POB Statistics For The Last Week:
The timeframe is from 2023-08-11 to 2023-08-18.
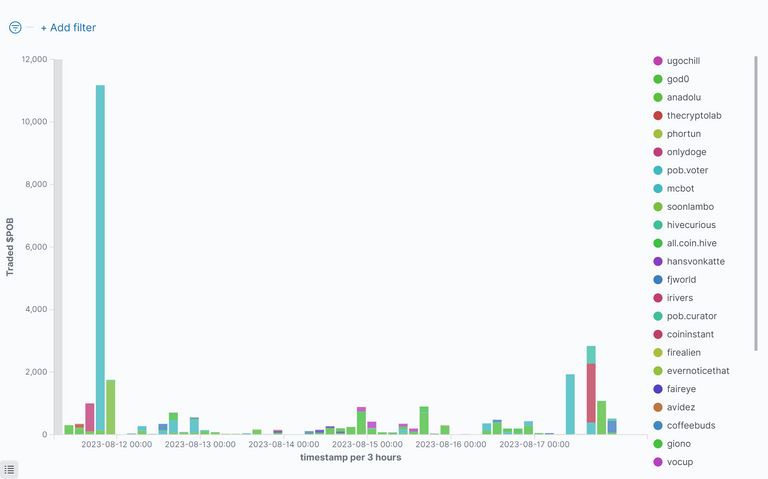
Bought $POB By Time
This figure shows who has bought how many $POB at which time:
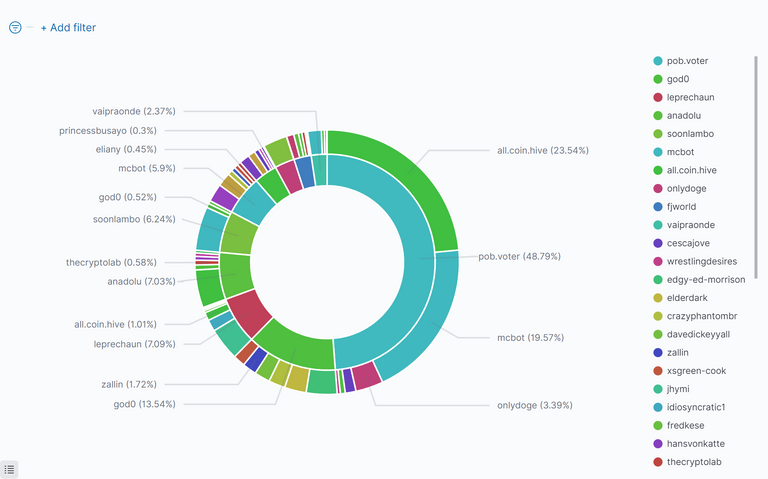
Top $POB Buyers And $HIVE Sellers
The inside of the circle shows the buyers of $POB, ordered by $HIVE they have spent. The outside shows the recipients of that $HIVE (sellers of $POB):
Commulated Amount Of Bought $POB Per Person
This figure shows the top 10 $POB buyers, how much they got and how much $HIVE they spend for this. It is sorted by $HIVE, that was spent:
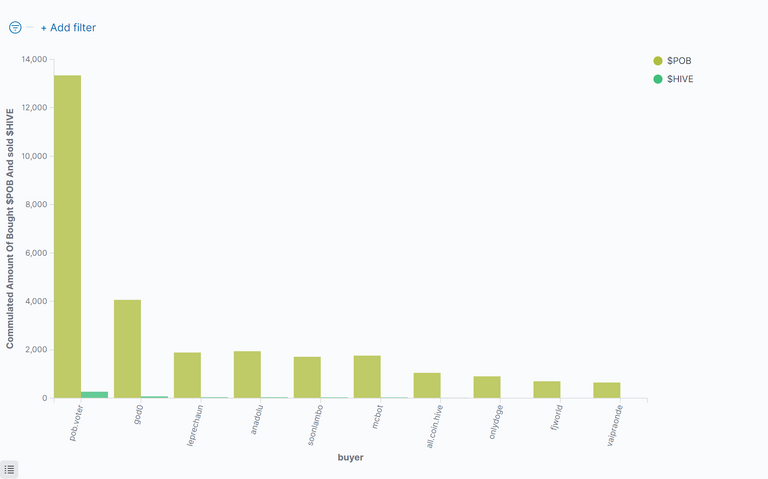
Table Of Top 20 $POB Buyers
This table shows the top ten buyers of $POB sorted by the $HIVE, they have spent:
| Buyer(Descending) | Sold $HIVE | % Sold $HIVE | Bought $POB | Avg. Price | Number of Trades |
|---|---|---|---|---|---|
| @pob.voter | 266.64610 | 46.17 % | 13338.99660 | 0.01975 | 36 |
| @god0 | 74.01996 | 12.82 % | 4062.62911 | 0.01830 | 231 |
| @leprechaun | 38.75687 | 6.71 % | 1886.73068 | 0.02035 | 15 |
| @anadolu | 38.45489 | 6.66 % | 1941.14385 | 0.01879 | 75 |
| @soonlambo | 34.12899 | 5.91 % | 1710.77697 | 0.01995 | 5 |
| @mcbot | 32.26644 | 5.59 % | 1759.31669 | 0.01845 | 39 |
| @all.coin.hive | 18.90643 | 3.27 % | 1046.45454 | 0.01804 | 18 |
| @onlydoge | 16.23195 | 2.81 % | 902.00293 | 0.01796 | 2 |
| @fjworld | 14.16664 | 2.45 % | 698.88533 | 0.02003 | 12 |
| @vaipraonde | 12.95378 | 2.24 % | 647.68894 | 0.02000 | 7 |
| @vocup | 9.12608 | 1.58 % | 505.55132 | 0.01799 | 10 |
| @faireye | 6.06018 | 1.05 % | 327.09091 | 0.01846 | 41 |
| @bulkathos | 3.55910 | 0.62 % | 181.68016 | 0.01959 | 3 |
| @hivecurious | 2.10021 | 0.36 % | 105.43909 | 0.01991 | 6 |
| @giono | 1.97754 | 0.34 % | 99.82574 | 0.01981 | 2 |
| @thecryptolab | 1.84835 | 0.32 % | 100.00000 | 0.01848 | 1 |
| @coffeebuds | 1.65612 | 0.29 % | 87.41370 | 0.01878 | 12 |
| @ugochill | 0.88905 | 0.15 % | 45.00000 | 0.01973 | 11 |
| @helios.trader | 0.70200 | 0.12 % | 37.18418 | 0.01888 | 3 |
| @avidez | 0.56103 | 0.10 % | 30.30969 | 0.01851 | 1 |
| others | 2.52891 | 0.44 % | 135.59564 | 0.02056 | 37 |
| Sum: | 577.54062 | 100 % | 29649.71607 | 0.01961 | 567 |
Commulated Amount Of Sold $POB Per Person
This figure shows the top 10 $POB Sellers, how much they sold and how much $HIVE they got for this, sorted by $HIVE:
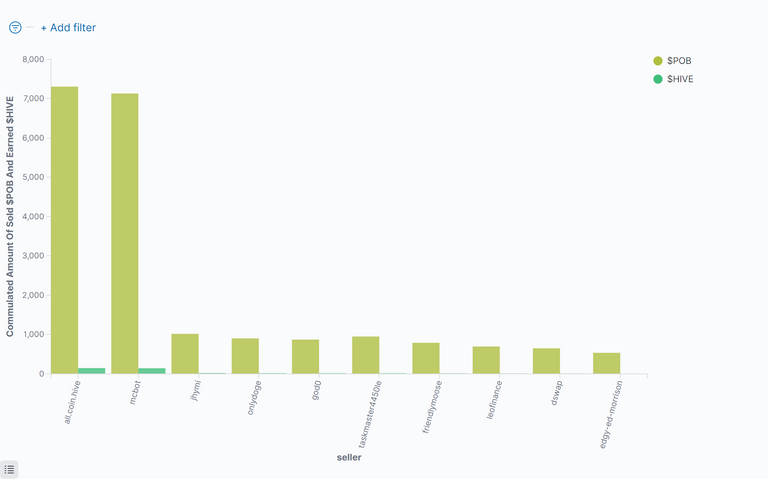
Table Of Top 20 $POB Sellers
This table shows the top ten sellers of $POB Sorted by the $HIVE, they have got:
| Seller(Descending) | Earned $HIVE | % Earned $HIVE | Sold $POB | Avg. Price | Number of Trades |
|---|---|---|---|---|---|
| @all.coin.hive | 147.19121 | 25.49 % | 7307.24017 | 0.02067 | 3 |
| @mcbot | 142.50331 | 24.67 % | 7131.46896 | 0.01950 | 8 |
| @jhymi | 20.86140 | 3.61 % | 1017.62927 | 0.02050 | 1 |
| @onlydoge | 18.00813 | 3.12 % | 902.12073 | 0.01996 | 1 |
| @god0 | 17.42210 | 3.02 % | 871.82810 | 0.01997 | 11 |
| @taskmaster4450le | 17.09184 | 2.96 % | 949.72970 | 0.01800 | 2 |
| @friendlymoose | 14.61106 | 2.53 % | 790.58091 | 0.01880 | 11 |
| @leofinance | 12.77654 | 2.21 % | 695.99999 | 0.01836 | 3 |
| @dswap | 11.84746 | 2.05 % | 651.32210 | 0.01831 | 22 |
| @edgy-ed-morrison | 9.60438 | 1.66 % | 535.63154 | 0.01793 | 6 |
| @idiosyncratic1 | 8.98809 | 1.56 % | 441.69259 | 0.02002 | 3 |
| @anadolu | 8.13118 | 1.41 % | 405.00543 | 0.02003 | 7 |
| @crazyphantombr | 7.88157 | 1.36 % | 418.12307 | 0.01874 | 7 |
| @cescajove | 6.95850 | 1.20 % | 348.45099 | 0.01997 | 1 |
| @elderdark | 6.90608 | 1.20 % | 385.13441 | 0.01793 | 2 |
| @merit.ahama | 5.95146 | 1.03 % | 321.94781 | 0.01843 | 8 |
| @michupa | 5.52899 | 0.96 % | 305.84825 | 0.01799 | 10 |
| @davedickeyyall | 5.21105 | 0.90 % | 290.00001 | 0.01797 | 2 |
| @zallin | 4.63665 | 0.80 % | 258.58279 | 0.01793 | 12 |
| @ydaiznfts | 4.57084 | 0.79 % | 246.88819 | 0.01851 | 5 |
| others | 100.85878 | 17.46 % | 5374.49112 | 0.01884 | 442 |
| Sum: | 577.54062 | 100 % | 29649.71613 | 0.01885 | 567 |
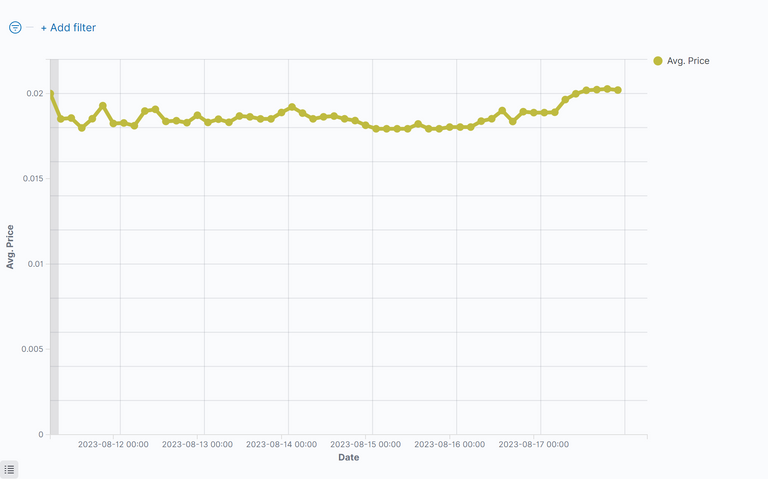
Price Of The $POB
This figure shows the price of $POB for the last period:
$POB Summarize Metrics
This table shows how much $HIVE was given by buy-requests, that where equal or higher than the sell order vs. sell-requests, that were equal or lower than the buy order.
If the buy-requests where higher than the sell-requests, then money comes into the system and the value of the token increases.
Under the total line one can see the sum of $HIVE and sum of $POB that changed the ownership and the average price of $POB for the last period.
| Request | Received Hive | Received HIVE % | Sold $POB | Avg. Price |
|---|---|---|---|---|
| sell | 329.22524 | 57.00% | 17245.84506 | 0.01852 |
| buy | 248.31536 | 43.00% | 12403.87102 | 0.01947 |
| sum: | 577.5406 | 100% | 29649.71608 | 0.01899 |
Comparison With Other Tokens
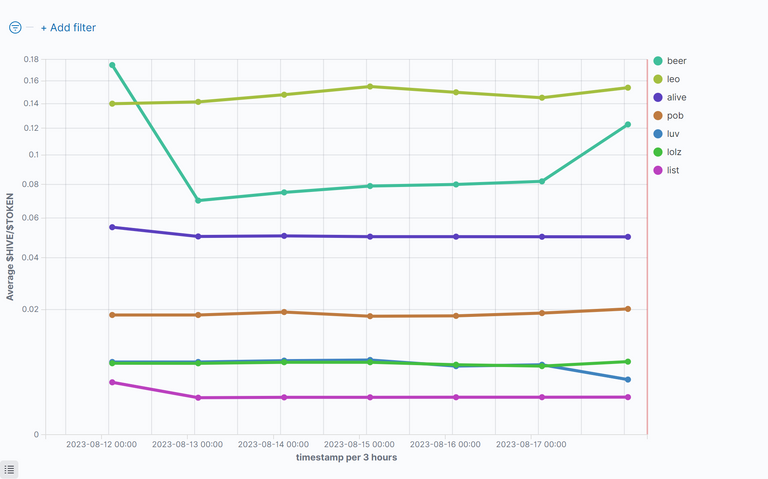
$HIVE/Token
This figure shows the value of $HIVE compared to some token for the last period. Be aware of the nonlinear (root square) y-axes.
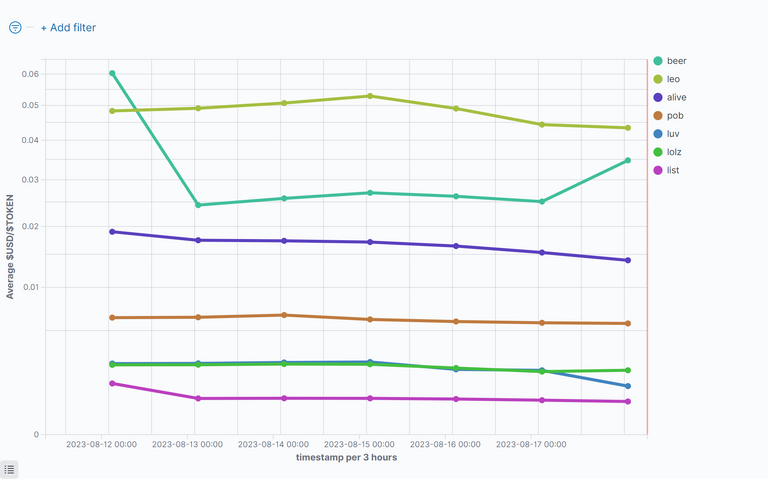
US-Dollar/Token
This figure shows the value of $USD compared to some token for the last period. Be aware of the nonlinear (root square) y-axes.
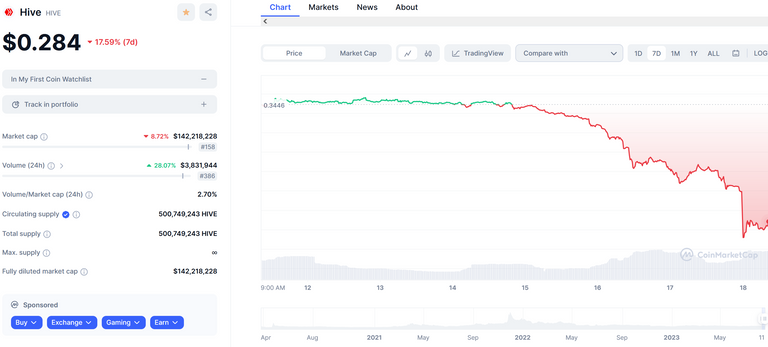
The HIVE rank in Coinmarktecap is: 158
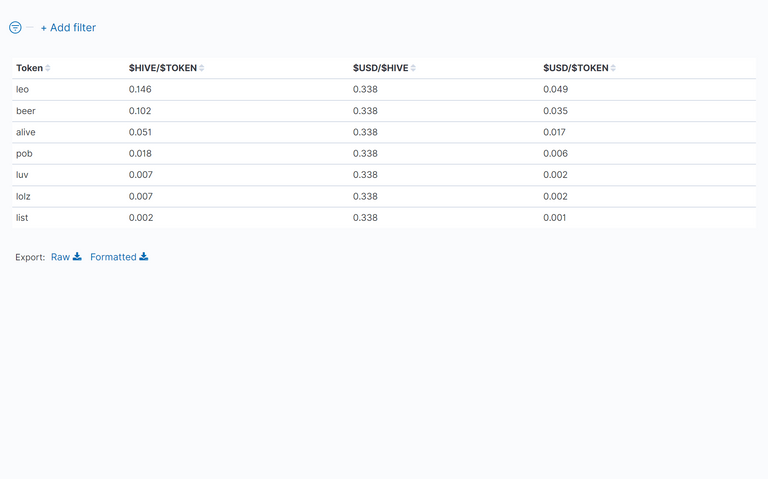
Table Of Token Prices in $HIVE and $USD
This table shows the average value of the prices of the token for the last period. One can see Hive and the US-Dollar compared to the token.
Disclaimer
All stats are without warranty.
They are taken from:
curl -XPOST -H "Content-type: application/json" -d '{ "jsonrpc": "2.0", "method": "find", "params": { "contract": "market", "table": "tradesHistory", "query": { "symbol": "TOKEN"}, "limit":1000, "offset": 0 }, "id": 1 }' 'https://api.hive-engine.com/rpc/contracts'
I have put them into logfiles and uploaded them to Kibana, from which I took the screenshots.
If you find errors, please tell me!
If you want me to continue the stats, give me some good upvotes ;-)
If you want to see other statistics (even from totaly other data), please contact me. I can create them weekly or monthly if I get some rewards for it.
For more details see here: How I Have Set Up Elasticsearch And Kibana On My Raspberry Pi To Monitor Token Activities and here: Do You Want To See Statistics Of Your Favorite HIVE Token? or on github.
Here are the stats from the other tokens I observe: https://peakd.com/@achimmertens/posts?filter=stats
Remark
All the Hive and HivePower, which is generated with this post, goes to my other account @anobel. I donate there the Hive to people that do good things and post about it.
You may follow @anobel and support my work there. See the latest post:
Regards, Achim Mertens
